Figures & data
Table 1. Chemical analysis of sea buckthorn and apricot powder, results are expressed in Mean standard deviation.
Table 2. Mean values of pH, acidity and TSS of a supplemented apricot probiotic drink. Values with different letters were significantly different (p ˂ 0.05).
Table 3. Mean values of color analysis (L*, a*, b*) of a supplemented apricot probiotic drink. Values with different letters were non-significantly different (p > .05).
Table 4. Mean values of total plate count (log CFU/mL) of a supplemented apricot probiotic drink. Values with different letters were significantly different (p ˂ 0.05).
Table 5. Mean values of total phenolic contents (mg GAE/L) and DPPH (%) of a supplemented apricot probiotic drink. Values with different letters were significantly different (p ˂ 0.05).
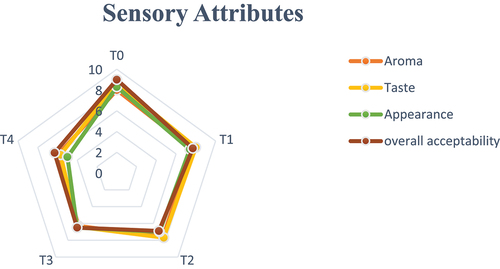
Figure 1. Mean preferences score for sensory attributes for a supplemented apricot probiotic drink.