Figures & data
Figure 1. Microwave assisted vacuum concentrator.
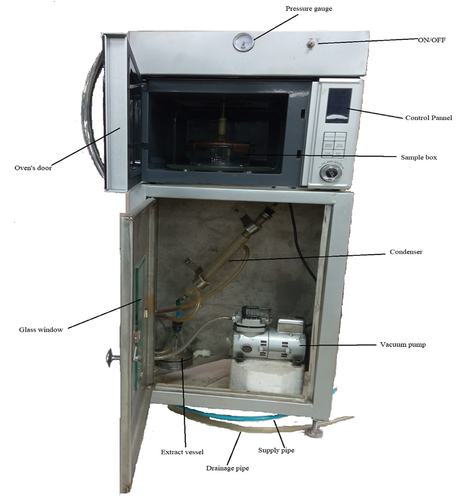
Table 1. Processing conditions to prepare juice concentrate.
Figure 2. Graphical representation of evaporation rate affected by power and time (a), pressure and time (b), power and pressure (c) and power, pressure and time (d). 35 KPa (▲), 70 KPa (■), and 70 KPa (●).
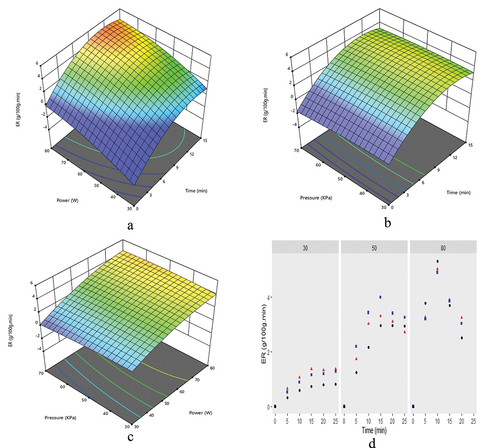
Figure 3. Graphical representation of moisture ratio affected by power and time (a), pressure and time (b), power and pressure (c) and power, pressure and time (d). Moroever, ▲, ■, and ● represent pressure values of 35, 50, and 70 KPa, respectively.
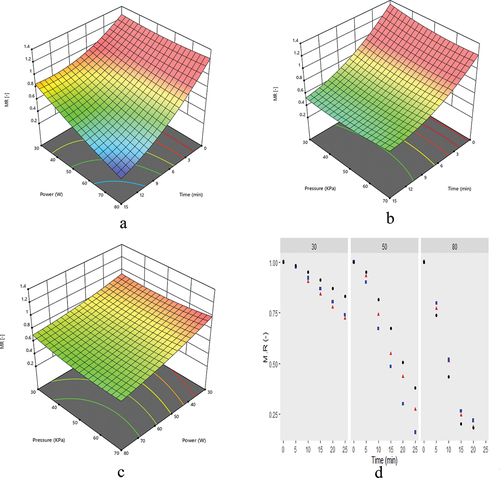
Table 2. Evaluation of different statistical models for moisture ratio at different powers and pressures.
Figure 4. Influence of pressure and power on DPPH a), TPC b), TFC c) and solubility index d) of grape pomace.
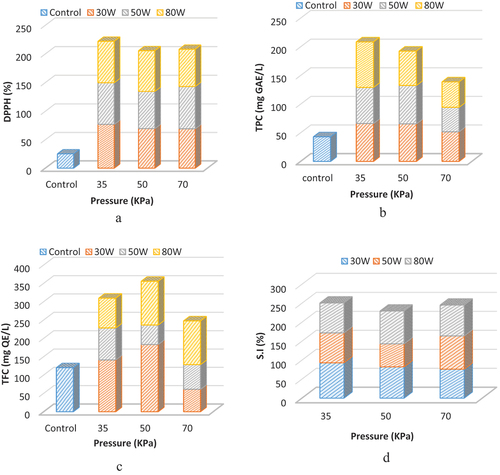
Table 3. Effect of microwave power and vacuum pressure on color parameters.
Figure 5. Influence of power and pressure on specific energy consumption (a) and extraction yield (b).
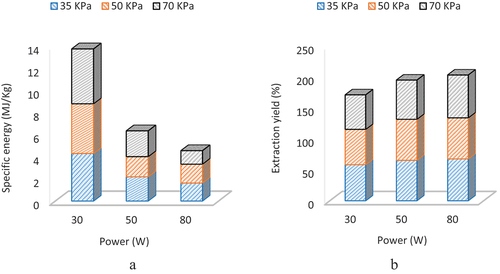
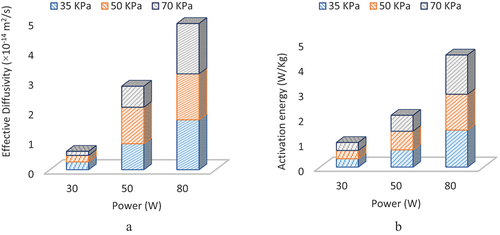
Figure 6. Effect of power and pressur on effective diffusivity (a) and activation energy (b).