
Figures & data
Table 1. Nucleotide sequences of primers used for qPCR and product sizes.
Figure 1. Effects of the shear rate on the shear stress and apparent viscosity of LNT and AS mixtures at different concentrations. (a, c) LNT; (b, d) LNT + AS (1:1/v:v).
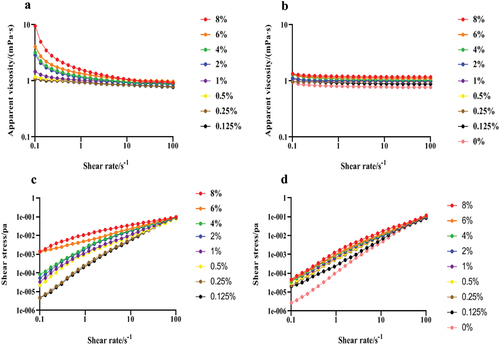
Table 2. Power Law model parameters for the LNT and AS mixture at different concentrations.
Figure 2. Tan δ of the LNT and AS mixture with different concentrations varied with oscillation frequency. (a) LNT; (b) LNT + AS (1:1/v:v).
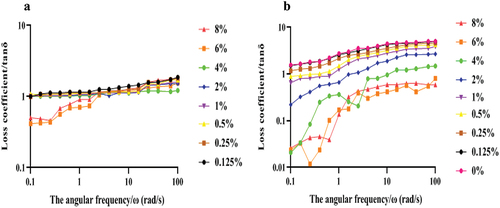
Figure 3. Particle size distribution of the LNT and AS mixture at different concentrations. (a) LNT; (b) LNT + AS (1:1/v:v).
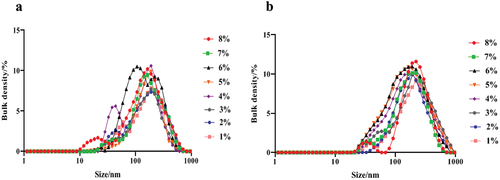
Table 3. Average particle size of the LNT and AS mixture with different concentration.
Table 4. Surface tension of the LNT and AS mixture at different concentrations.
Table 5. Comparison of solution fracture time at different tensile speeds.
Table 6. Comparison of solution fracture height at different tensile speeds.
Figure 4. Solution tensile height and tensile stress at different tensile speeds. (a)5 mm/s; (b) 1 mm/s; (c) 0.2 mm/s; (d) 0.04 mm/s.
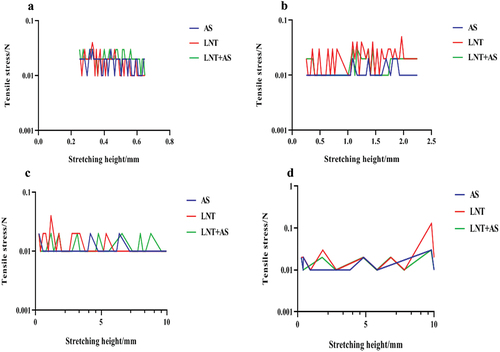
Figure 5. Bacteriostasis rate of different concentrations of LNT and AS on oral bacteria. (a) S. mutans; (b) S. salialis; (c) A. viscosus; (d) S. sanguinis; (e) C. albicans. Values represent the mean ± SD (n = 3).
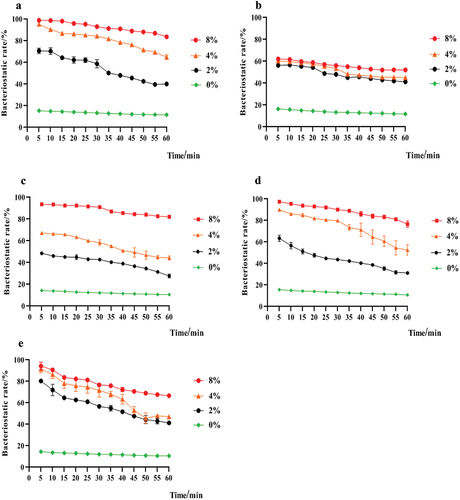
Figure 6. Effects of the mixture of LNT and AS on cell morphology of S. mutans. (a) 0%; (b) 2%; (c) 4%; (d) 8%.
Figure 7. Effects of the mixture of LNT and AS at different concentrations on cell structure of S. mutans. (a) 0%; (b) 2%; (c) 4%; (d) 8%.
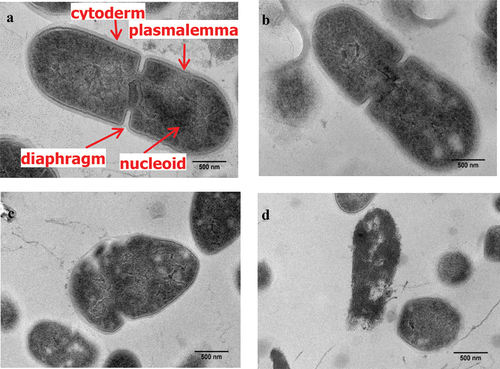
Figure 8. Effects of the mixture of LNT and AS on intracellular biomacromolecules in S. mutans. Error bars show standard deviation (n = 3). *, ** and *** indicated respectively p < .05, p < .01 and p < .001 statistically significant difference compared with blank group. a. nucleic acid leakage; b. soluble protein concentration; c. electrical conductivity; d. β -galactosidase activity.
Figure 9. Effects of the mixture of LNT and AS on fluorescence intensity of S. mutans. (a) 0%; (b) 2%; (c) 4%; (d) 8%.
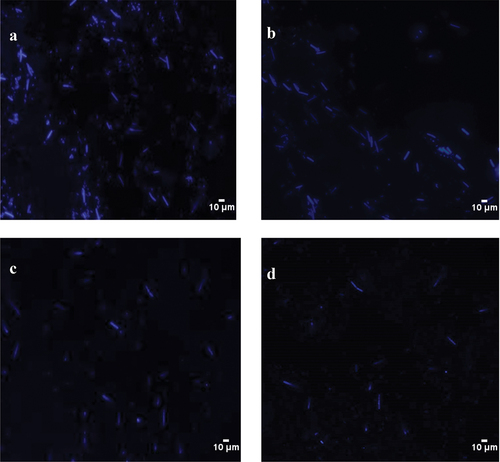
Figure 10. Effects of the LNT and AS mixture on AKP activity and ATP content of S. mutans (Values represent the mean ± SD (n = 3). * and ** indicated respectively p < .05 and p < .01 statistically significant difference compared with blank group.
Figure 11. Effects of the LNT and AS mixture on gene expression involved to the glycolysis pathway in S. mutans (a) glk; (b) pfk; (c) pgk; (d) pykF; (e) ackA. Values represent the mean ± SD (n = 5). Significant differences were expressed in letters (p < .05).
Table 7. Effects of the LNT and AS mixture on acid production of S. mutans.