
Figures & data
Figure 1. Acidification curve of oat drink by selected combinations of starter cultures. a,b,c,d same lowercase letters indicate no statistically significant difference (α = 0.05; n = 4). Legend: YC – oat drink samples fermented with a starter culture YC-X16; YC-BB – oat drink samples fermented by the starter culture YC-X16 and Bifidobacterium animalis subsp. lactis BB-12; YC-PS – oat drink samples fermented with the starter culture YC-X16 and Propionibacterium PS-4; and YC-BB-PS – oat drink samples fermented with a starter culture YC-X16, Bifidobacterium animalis subsp. lactis BB-12 and Propionibacterium PS-4.
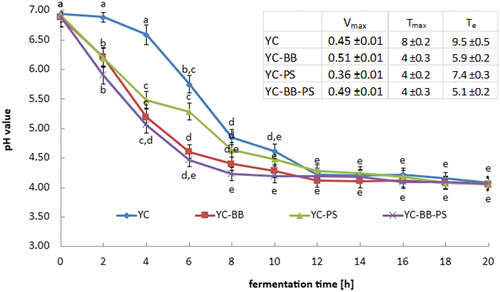
Table 1. Change in pH during refrigerated storage of fermented oat drinks (average values and standard deviations).
Table 2. Change in bacterial cell population [log(CFU/g)] during refrigerated storage of fermented oat drinks (average values and standard deviations).
Figure 2. Change in hardness and adhesiveness during refrigerated storage of fermented oat drinks (average values and standard deviations).
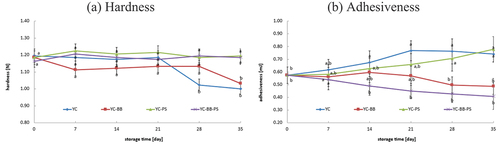
Figure 3. Change in sugar content during refrigerated storage of fermented oat drinks (a) YC, (b) YC-BB, (c) YC-PS, and (d) YC-BB-PS.
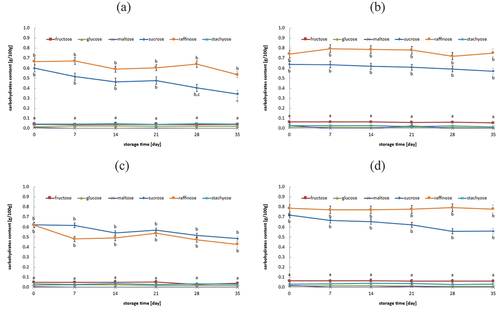
Table 3. Change in water-holding capacity during refrigerated storage of fermented oat drinks (average values and standard deviations).
Data availability statement
The data that support the findings of this study are available from the corresponding author (M.Z.) upon reasonable request.