Figures & data
Figure 1. Geographical location of study site (a) and schematic representation of the study process flow diagram (b).
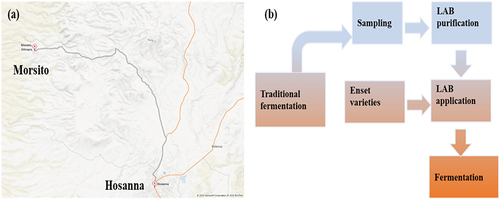
Figure 2. Sample collection and traditional Qotcho fermentation: Pit of fermentation for samples (Month-1, Month-3 and Month-6) (a), fermented mass wrapping with Enset leaves (koba) (b) and Samples of Month-1, Month-3 and Month-6 in polyethylene bag (c).
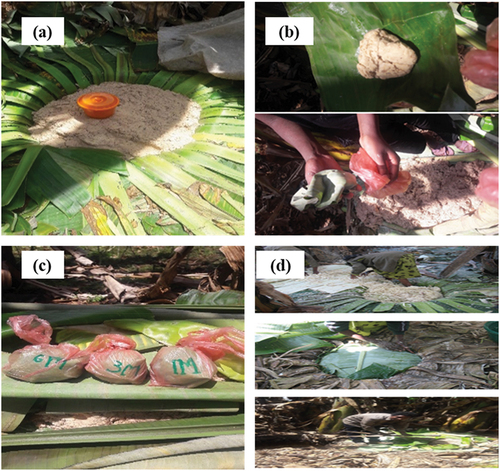
Figure 3. Dynamic nature of microbial fermentation: Temperature record (a), pH measurement (b) colony forming units of LAB in laboratory at 30°C (c), and pH of fermentation in laboratory at 30°C (d) of Qotcho samples.
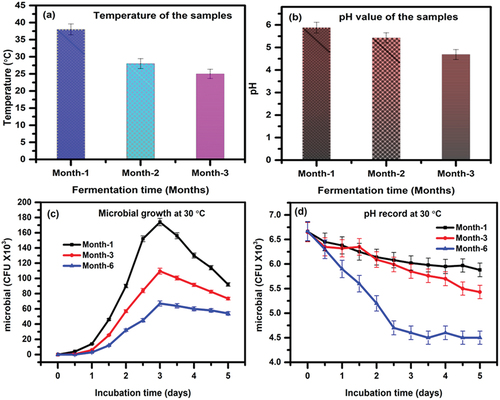
Figure 4. Microbial growth kinetics in the form of CFU at different temperatures: LAB fermentation on Agade (a), LAB fermentation on Disho (b) LAB fermentation on Gimbo (c) and LAB fermentation on all samples with control at 30°C (d) over 36 days of fermentation.
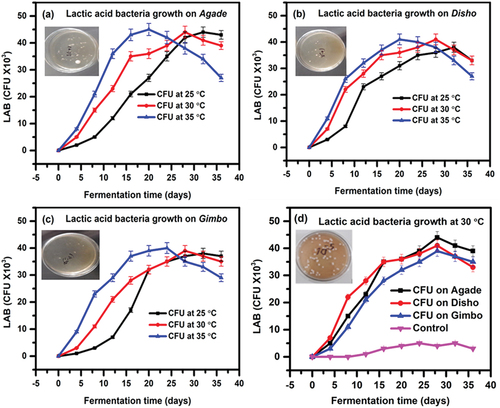
Figure 5. pH measurement at different temperatures: pH record on Agade (a), pH record on Disho (b) pH record on Gimbo (c), and pH record on all samples with control at 30°C (d) over 36 days of fermentation.
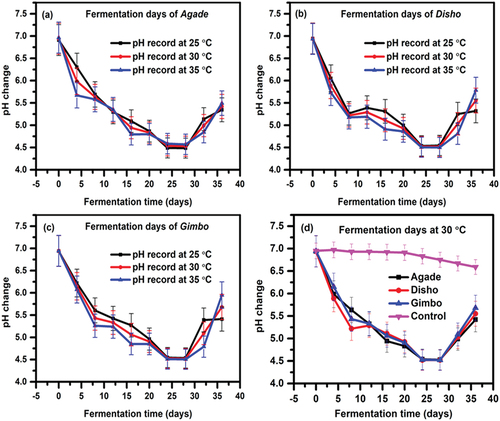
Table 1. Colony forming units of LAB in different fresh Enset varieties at different temperature ranges.
Table 2. Analysis of Variance (ANOVA), General factorial regression: pH versus samples, temperature, fermentation time.
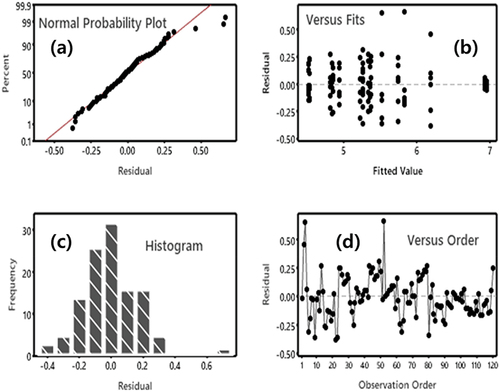
Figure 6. Statistical analysis of pH measurement at different temperatures for all samples: Normal probability plot (a), individual point plot (b) histogram of residual plot (c), and data point plot on time series (d) over 36 days of pH observation.