
Figures & data
Table 1. Treatment plan.
Table 2. Description of milk fermentation model.
Figure 1. FTIR transmittance spectra for citrus peel powder, insoluble and soluble fractions of citrus peel powder extracts.
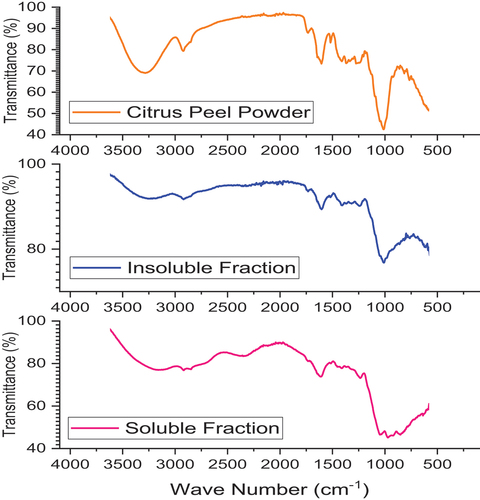
Table 3. Characterization of prebiotic extracted from citrus peel.
Table 4. Mean squares for microbial growth affected by prebiotic as a function of time.
Figure 2. Growth of L. reuteri over the period of time at different concentrations of prebiotic.
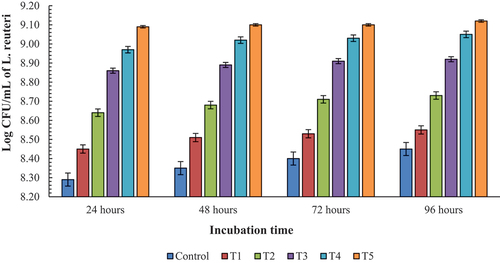
Figure 3. Growth of Bifidobacterium over the period of time at different concentrations of prebiotic.
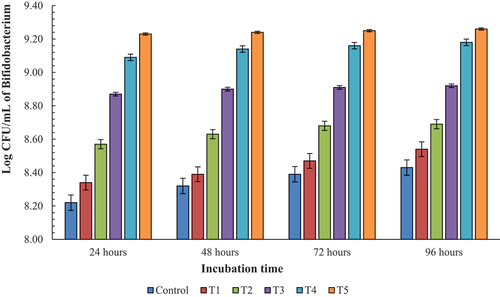
Figure 4. Growth of L. reuteri and Bifidobacterium in co-culture system over the period of time at different concentrations of prebiotic.
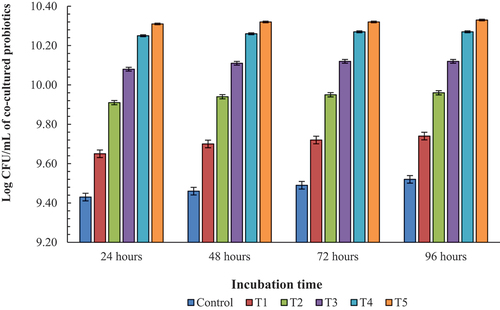
Figure 5. Growth of L. reuteri (L1), Bifidobacterium (B1), E. coli (E1) and co-culture of probiotic bacteria (LbB1) at different concentrations of prebiotic (spread plated on MRS and MacConkey agar).
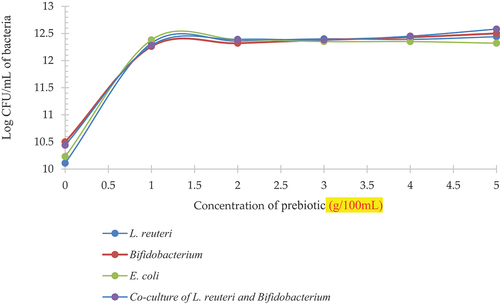
Table 5. Mean squares for microbial growth affected by prebiotic in milk.
Figure 6. Log CFU/mL of E. coli incubated with L. reuteri (E2), E. coli incubated with Bifidobacterium (E3), E. coli incubated with L. reuteri and Bifidobacterium (E4) at different concentrations of prebiotic (spread plated on MacConkey agar).
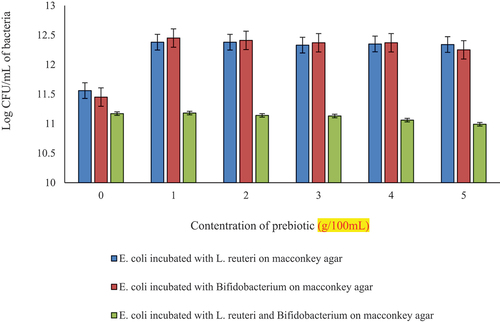
Table 6. Mean squares for microbial growth affected by prebiotic in milk grown on MacConkey agar.
Figure 7. Log CFU of L. reuteri incubated with E. coli (L2), Bifidobacterium incubated with E. coli (B2), L. reuteri and Bifidobacterium incubated with E. coli (LbB2) at different concentrations of prebiotic (spread plated on MRS agar).
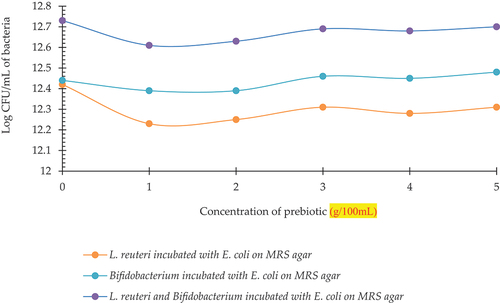
Table 7. Mean squares for microbial growth affected by prebiotic in milk grown on MRS agar.
Figure 8. Log CFU/mL of E. coli (E1), E. coli incubated with L. reuteri (E5), E. coli incubated with Bifidobacterium (E6) at different concentrations of prebiotic (spread plated on MRS agar).
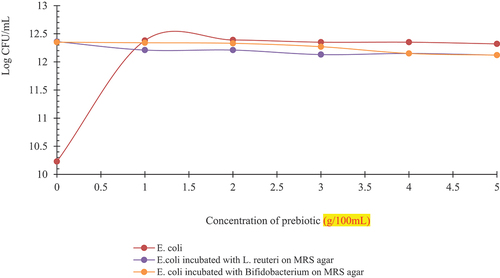
Table 8. Mean squares for microbial growth affected by prebiotic in milk grown on MRS agar.
Data availability statement
Data will be shared upon request.