Figures & data
Figure 1. Swelling volume of modified gadung starch by FMT and HMT. Graphs marked with different letters indicate significant differences at p < .05.
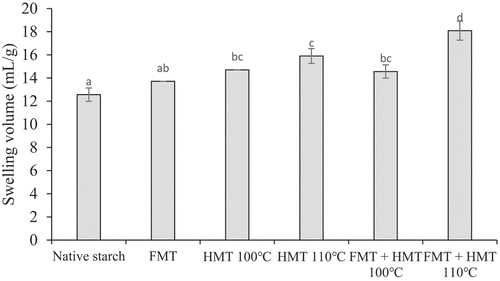
Figure 2. Solubility of modified gadung starch by FMT and HMT. Graphs marked with different letters indicate significant differences at p < .05.
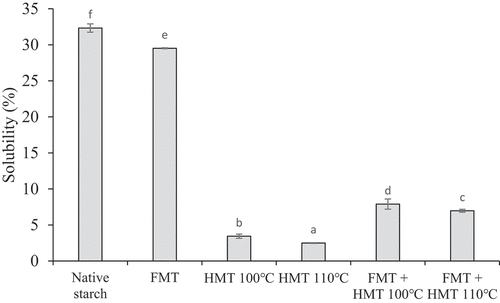
Figure 3. WAC of modified gadung starch by FMT and HMT. Graphs marked with different letters indicate significant differences at p < .05.
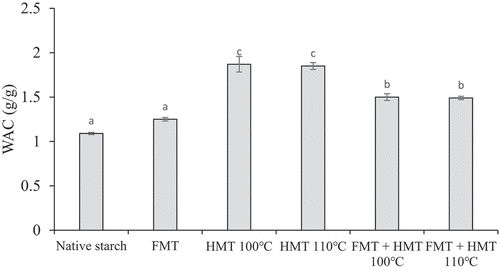
Table 1. Color chromaticity of modified gadung starch by FMT and HMT.
Figure 4. Morphological characteristics of modified gadung starch by FMT and HMT at a magnification of 7000X. Pores and cracks were marked by red arrows.
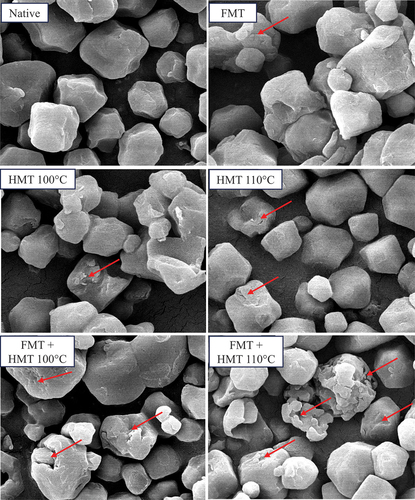
Figure 5. Pasting curves of modified gadung starch by FMT and HMT.
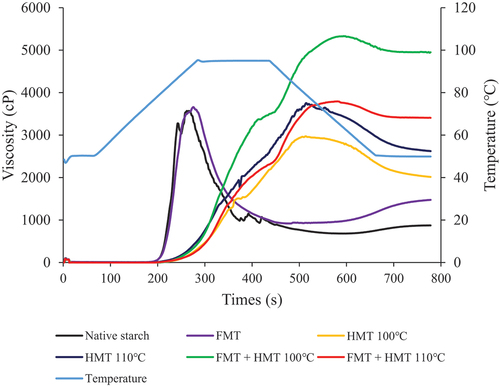
Table 2. Pasting properties of modified gadung starch by FMT and HMT.
Figure 6. The diffractogram of native and modified gadung starch by FMT + HMT 110°C.
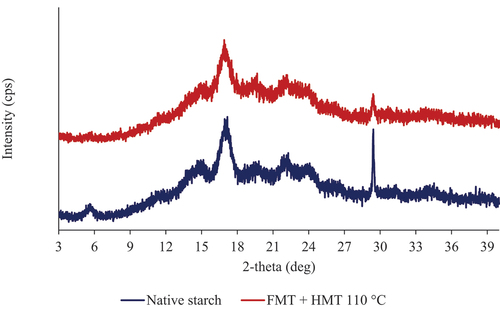
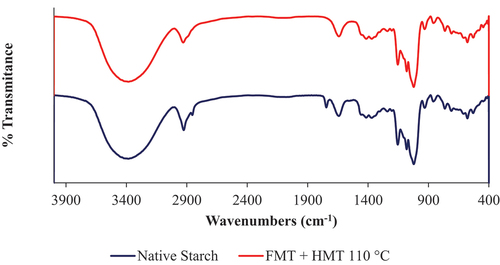
Figure 7. FTIR spectra of native and modified gadung starch by FMT + HMT 110°C.