Figures & data
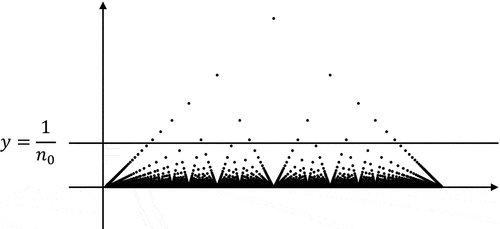
Figure 1. The graph of the popcorn function on (0,1).Footnote5
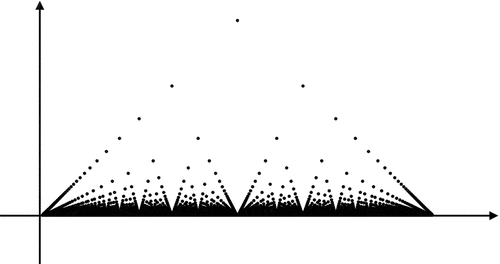
Figure 2. Part of the table-of-events of Lesson-P (“x” denoting the event was memorable for Student-P#; Event 3 identified as a KME).
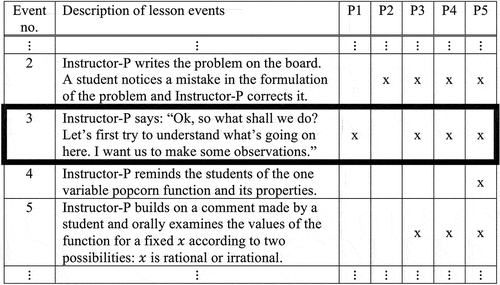
Figure 3. Part of the table-of-events of Lesson-N (“x” denoting the event was memorable for Student-N#; Events 7 and 8 identified as a combined KME).Footnote7
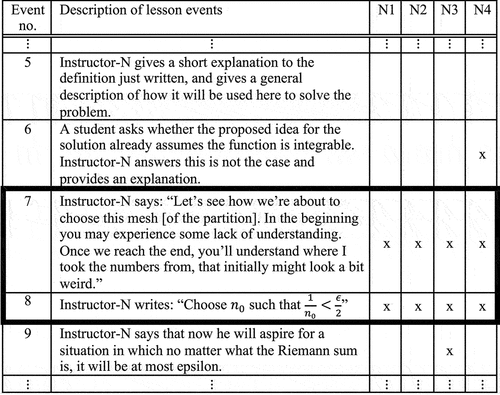
Figure 4. A finite set of values larger than .