Figures & data
Figure 1. Allelopathic effect of 4-hydroxybenzoic acid on the fresh weights of the aboveground (a) and belowground components (b) of grapevine cuttings.
Figure 2. The diversity based on the DGGE analysis of the bacterial community in Group 1 (a) and Group 2 (b). Note: Soil without grapevine cuttings (Group 1); soil with grapevine cuttings (Group 2); different letters indicate significant differences (P < 0.5, Tukey's HSD test).
Figure 3. The diversity based on the DGGE analysis of the fungal community in Group 1 (a) and Group 2 (b). Note: Soil without grapevine cuttings (Group 1); soil with grapevine cuttings (Group 2); different letters indicate significant differences (P < 0.5, Tukey's HSD test).
Table 1. Average Shannon index based on the DGGE of the soil microbial community at five sampling periods (6, 12, 18, 24 and 30 d after treatment).
Figure 4. The functional diversity based on Biolog EcoPlates in Group 1 (a) and Group 2 (b). Note: Soil without grapevine cuttings (Group 1); soil with grapevine cuttings (Group 2); different letters indicate significant differences (P < 0.5, Tukey's HSD test).
Figure 5. Average Shannon index based on Biolog EcoPlates in the soil microbial community at five sampling periods (6, 12, 18, 24 and 30 d after treatment). Note: Soil without grapevine cuttings (Group 1); soil with grapevine cuttings (Group 2).
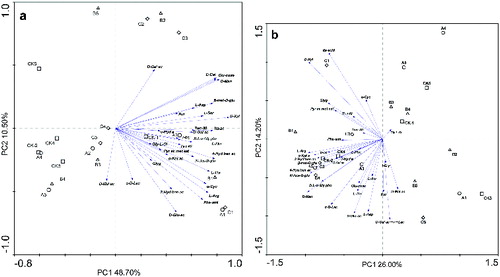
Figure 6. Principal component analysis of carbon substrate utilization patterns obtained using Biolog EcoPlates for Group 1 (a) and Group 2 (b). Note: CK, A, B and C represent 0.0, 0.5, 1.0 and 2.0 mg/g treatment, respectively; 1, 2, 3, 4 and 5 represent 6, 12, 18, 24 and 30 d after treatment, respectively.