
Figures & data
Figure 1. Melting-temperature curve of the target sequence of A. cerana.
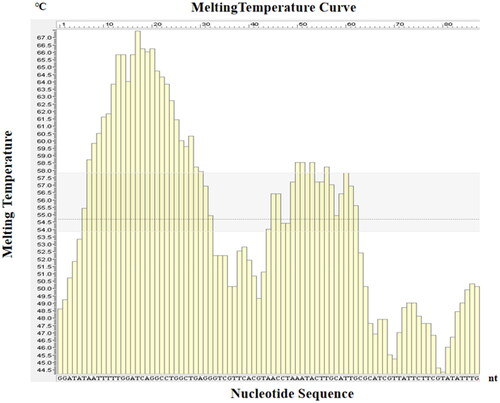
Table 1. Primers and probe sequences of the Proofman-LMTIA method.
Figure 2. Temperature optimization of the Proofman-LMTIA reaction: 60 °C (A); 61 °C (B); 62 °C (C); 63 °C (D).
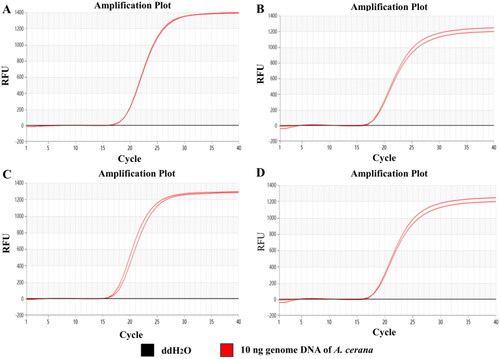
Figure 3. Specificity determination of the Proofman-LMTIA method.
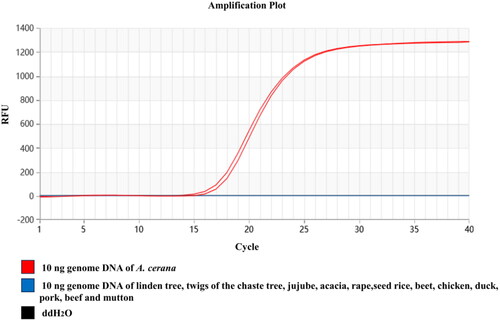
Figure 4. Sensitivity determination of the Proofman-LMTIA method.
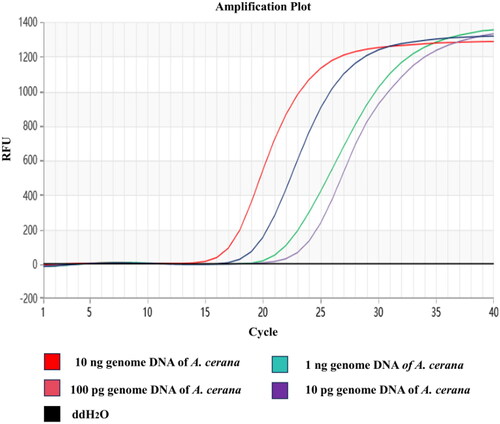
Figure 5. Scatter plot of the sensitivity determination with the droplet digital PCR method.
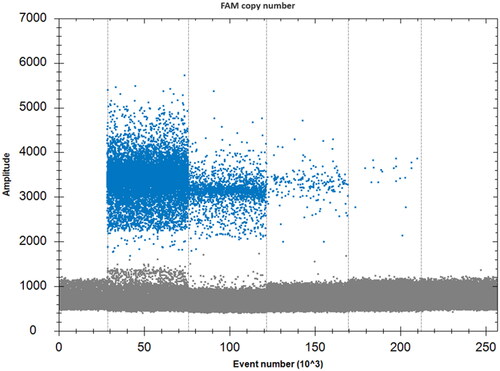
Table 2. Copy number and total drop number determined with the droplet digital PCR method.
Table 3. Results of A. cerana honey samples determined with the Proofman-LMTIA.
Data availability statement
The data that support this study are available from the corresponding author upon reasonable request.