
Figures & data
Table 1. Sample means and standard deviations of the scales and correlations between the scales.
Table 2. The latent profile solutions of 1–5 classes.
Figure 1. Profiles based on perceived knowledge sharing and fit including received recognition and constructive climate.
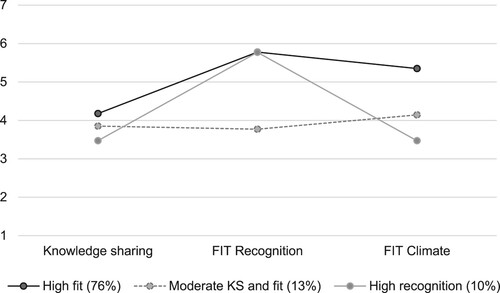
Table 3. Profile means and standard deviations.