Figures & data
Table 1. Teacher demographics.
Table 2. Percentage of teachers favouring the inclusion of CCE in each subject area.
Table 3 . The relative priority teachers assigned to curriculum areas for allocating additional school funding.
Table 4. Percentage agreement with statements indicating current engagement with students around climate change.
Table 5. Percentage agreement with statements related to climate belief, school encouragement, resource availability and feeling comfortable delivering CCE.
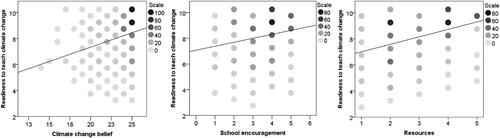
Figure 2. Scatter plots of feeling comfortable to deliver CCE against climate change belief, school encouragement (response to statement 8 in ) and resource availability (response to statement 9 in ).
Note: Shading represents the number of participants corresponding to each data point