Figures & data
Table 1. Information about ECE institutions and participants.
Figure 1. Word cloud showing frequency (proportional letter size) of the 23 categories of core concepts from the first iterative coding process.
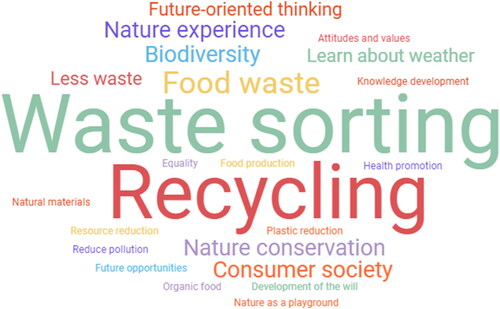
Figure 2. Percentage distribution (numbers in bar chart) of keywords in four parent codes from the last iterative coding process.
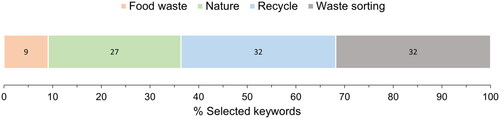
Figure 3. Mean (±SD) of an agreement to claims presented in the survey. Green bars (C1–3) concern the understanding of sustainability, blue bars (C4–5) concern didactic practice in sustainability, and grey bars (C6–8) concern what place sustainability has in ECE as an organisation.
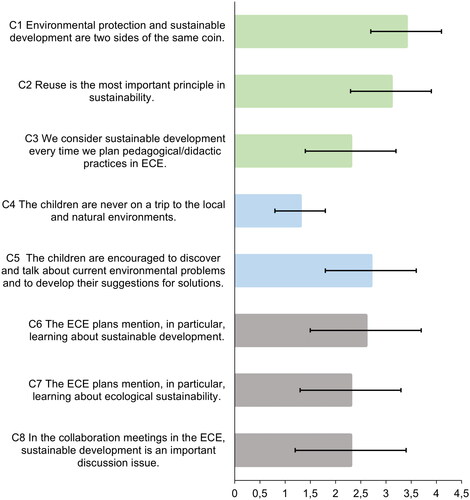
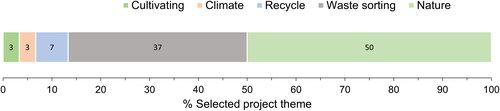
Figure 4. Percent of selected theme (numbers in bar chart) in didactic development projects limited to the environmental dimension of sustainability.