
Figures & data
Figure 1. Experimental design of protocol for neuroblastoma cells. Cells were cultured in vitro and subjected to hypoxia. After 24 h, the culture medium was replaced by ozonized medium at different concentrations for 5 min, incubated for another 24 h, and then evaluated.
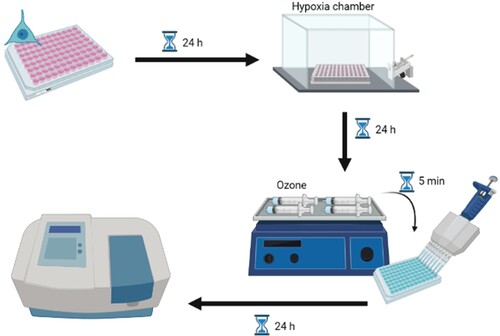
Figure 2. Isolation of canine amniotic membrane stem cells. A: Fetus in the first-third of the gestational period surrounded by the placenta. B: Dissection of amniotic membrane. C: Amniotic membrane in a culture plate.
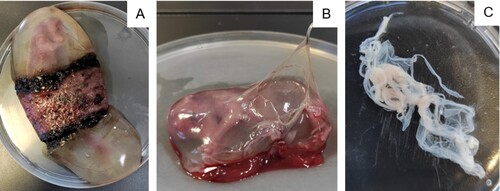
Figure 3. SH-SY5Y MTT (A) and AMSC MTT (A), SOD (B), and CAT (C) quantification, where p < 0.05. During the MTT test, cells not subjected to the hypoxia protocol were considered 100%. We observed a pattern of reversal of the hypoxia effect and the promotion of cell regeneration at low ozone concentrations. Cellular apoptosis at high ozone concentrations was prominent in both kinds of cells (A and B). We also observed that SOD spectrophotometry results were inconsistent (C) and that high ozone concentrations promoted a decrease in catalase rate after hypoxia induction (D).
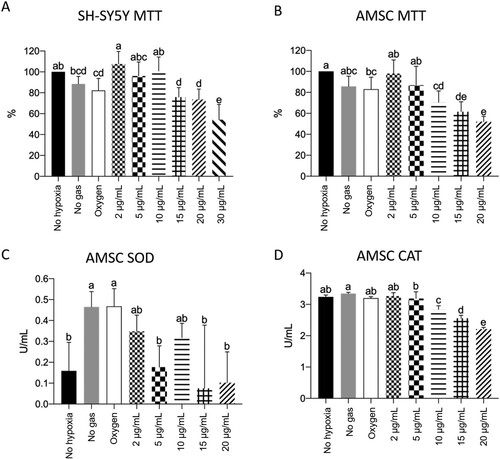
Figure 4. The higher the ozone level, the higher the rate of cell apoptosis. A: Representative pictures of cell apoptosis measured by TUNEL assay. C: Quantification of cell apoptosis (Gray-value, calculated by ImageJ), where p < 0.05.
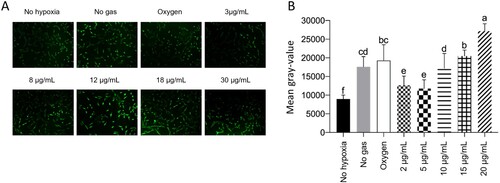
Figure 5. No treatment was of significant importance for lipid peroxidation. A: Representative pictures of lipidic peroxidation measured by Image-iT assay. B: Non-oxidized cells (red) and oxidized cells (green) measured by flow cytometry. C: Quantifying oxidized and non-oxidized cells (Q2-UR), where p < 0.05.
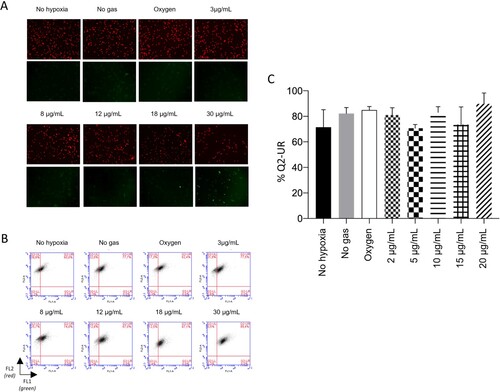
Figure 6. Low ozone concentrations do not increase the rate of reactive oxygen species (ROS). A: Representative pictures of ROS, as detected via CellROX Green assay. B: ROS examined via flow cytometry (FL1). C: Quantification of ROS levels, where p < 0.05.
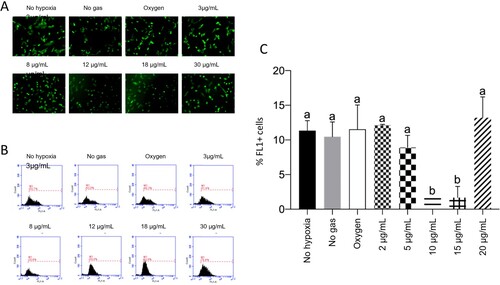
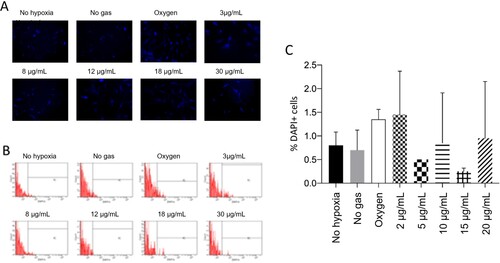
Figure 7. No treatment showed a significant difference in reduced glutathione level. A: Representative pictures of reduced glutathione (GSH) measured by CellTracker Blue assay. B: Reduced GSH measured by flow cytometry. C: Quantification of reduced GSH (DAPI), where p < 0.05.
Data Availability Statement
Data sharing not applicable to this article as no datasets were generated or analysed during the current study.