Figures & data
Figure 1. Final factor model of school leaders (n = 301) attitudes towards practices (prac), vision (vis) and view of availability of support (sup) in inclusive education. Fit indices: χ²/df = 3.38, RMSEA = .089, CFI = .973, TLI = .959, WRMR = 0.789. Parameter estimates were obtained using WLSMV with THETA parametrisation, the values are standardised and significant. Numbers in rectangles are the item numbers in the questionnaire.
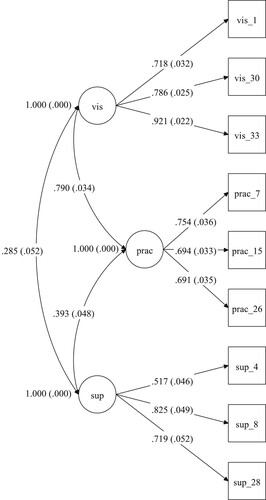
Table 1. Fit indices of the Confirmatory Factor Analysis models describing ATIES-EST test.
Table 2. Descriptive statistics of school leaders (n=301) attitudes towards inclusive ATIES-EST test (7-point scale, ranging from −3 to +3).
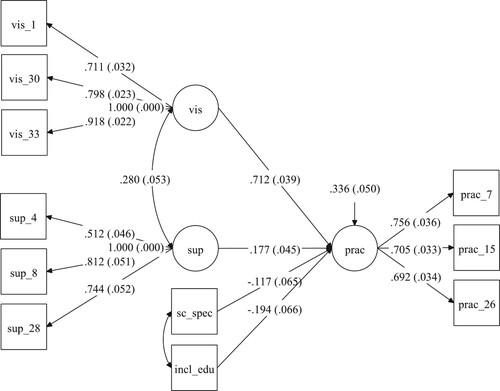
Figure 2. SEM model for predicting attitudes towards practice (prac) in inclusive education based on school leaders vision (vis), view of availability of support (sup), school type (se_spec; 1 = mainstream school, 2 = special school), and experience of participation in in-service courses focusing on inclusive education (incl_edu; 1 = not at all, 2 = slightly, 3 = a lot (at least 40 hours)). Fit indices: χ²/df = 2.50, RMSEA = .071, CFI = .973, TLI = .963, WRMR = 0.883. Parameter estimates were obtained using WLSMV with THETA parametrisation, the values are standardised and significant. The numbers in rectangles are the item numbers in the questionnaire.