
Figures & data
Figure 1. Main features of our eight-week FIFA intervention. AM Argument mapping.
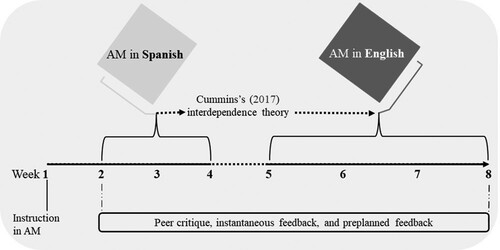
Table 1. Description of our FIFA intervention per week.
Figure 2. An argument map constructed by U30 as response to the Argumentative question 5 (Appendix 1).
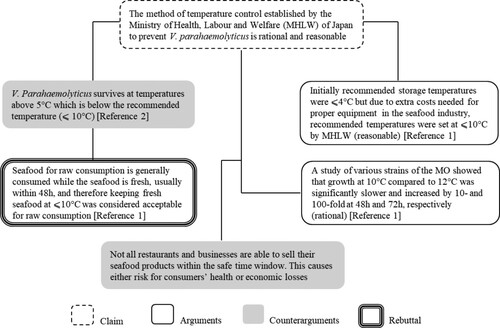
Table 2. Rubric for scoring participants’ argument maps.
Table 3. Details of the 1756 boxes of the 291 argument maps coded.
Table 4. Means, standard deviations, and total scores of the argument maps constructed per week (N = 44).
Figure 3. An Argument map constructed by U5 as response to the Argumentative question 5 (Appendix 1).
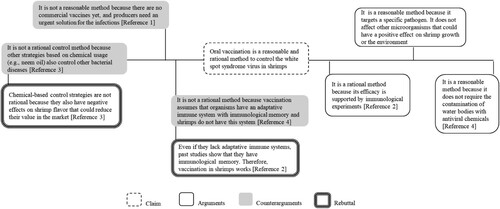
Figure 4. Number of students who created their maps in Spanish, in English or in Spanish-English code-switching. AM Argument map.
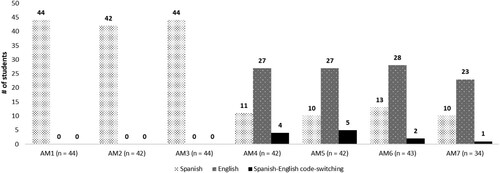
Table 5. Descriptive statistics of survey questions 8–15.