
Figures & data
Table 1. Descriptive statistics of variables by gender.
Table 2. Logistic regressions of the likelihood to enter traditional university rather than university of applied sciences.
Table 3. Percentage of the gender difference in the choice for traditional university versus university of applied sciences explained by background characteristics (Fairlie decomposition).
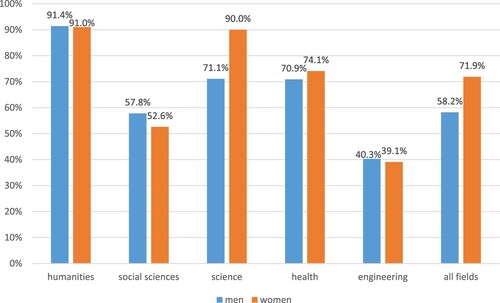
Figure 1. Share of female and male higher education students choosing traditional university by field of study (observed percentages).
Supplemental Material
Download MS Word (35.3 KB)Data and code availability
The data that support the findings of this study are available on request from the Leibniz Institute for Educational Trajectories (LIfBi; https://doi.org/10.5157/NEPS:SC5:14.0.0). The data are not publicly available because they could compromise the privacy of research participants, but can be requested at LIfBi.