
Figures & data
Figure 1. Model of teacher competence (adapted from Lindmeier, Citation2011).
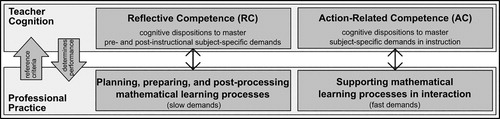
Figure 2. Schematic overview of the study design.
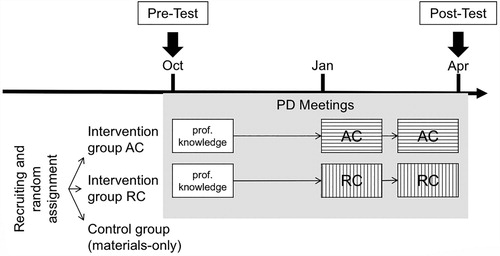
Table 1. Descriptives for pre- and post-test scores, tests of difference, and effect sizes.
Table 2. Parameter estimates for the full linear mixed models, reference: control group at pre-test, shaded cells indicate where we expected to find effects according to our hypotheses.
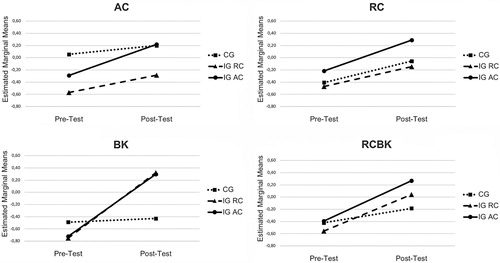
Figure 3. Graphical display of the estimated marginal means according to the full linear mixed models.
Supplemental material