Figures & data
Figure 1. The manipulation phases for each of the conditions EC, ES and NEC. Conditions across children only differed in phase 2.
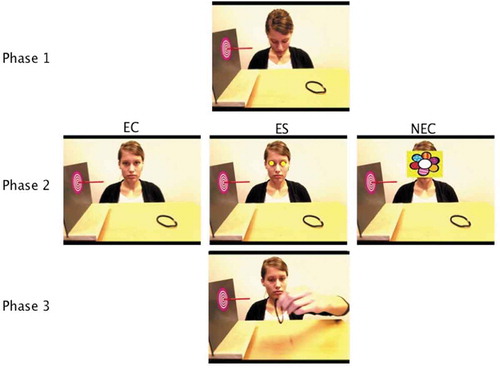
Figure 2. The regions of interest consisting of 1) the eye-region, 2) the goal region of the static object, 3) the whole static object, 4) the dynamic object and, 5) all else.
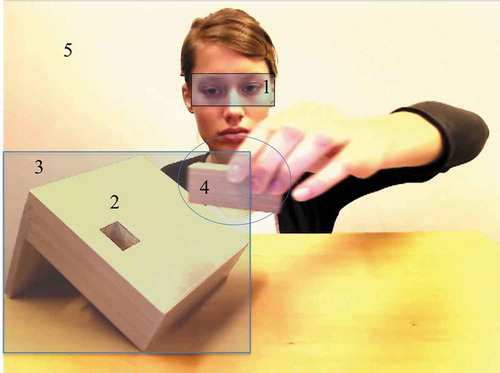
Figure 3. Odds Ratios of effect estimates of the mixed effects model for each of the conditions EC, ES and NEC with 95% bootstrap Confidence Intervals (1000 bootstrap simulations).
Figure 4. Average percentage of time spent looking at a Region of Interest relative to the total amount of looking time of infants across conditions.
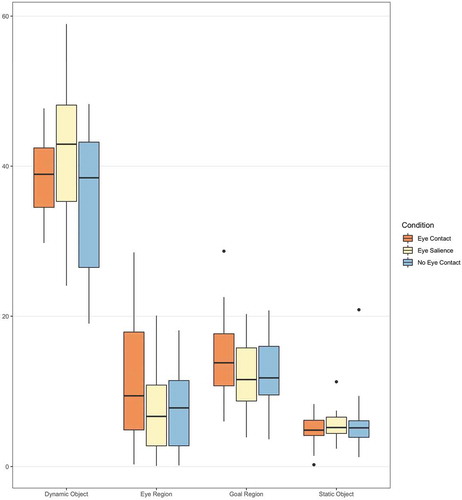
Figure 5. Time series displaying the percentage of infants looking at an ROI (different lines) at a given time, averaged across conditions. The upper panel shows infants successful in affordance completion, the lower panel the infants that were unsuccessful.
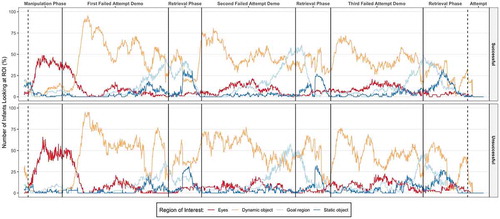
Figure 6. Difference score times series of successful infants (top of each panel) versus unsuccessful infants (bottom of each panel) across all conditions. The y-axis represents the proportion Z scores. The EC condition is in the top panel, ES condition in the middle panel, and NEC in the bottom panel. The color codes in the center of the graphs indicate whether significantly more successful or unsuccessful looked at a specific ROI (see text for details).
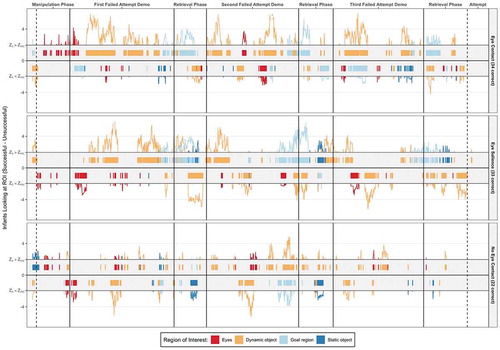
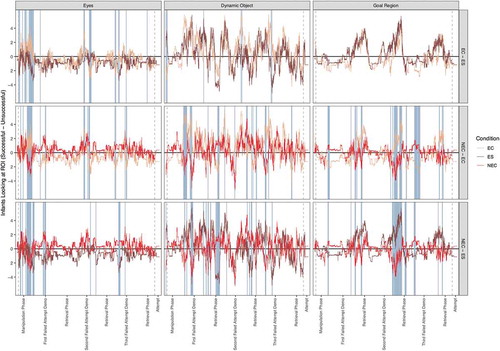
Figure 7. Presented are comparisons across conditions (EC and ES in the top panel, NEC and ES in the middle panel, and NEC and EC in the lower panel) of the time series of difference scores between successful and unsuccessful infants per region of interest (Eyes in the left panel, Dynamic Object in the middle panel and the Goal Region in the right panel). The y-axis represents proportions of Z scores. The vertical colored bands indicate significant differences across the conditions according to a permutation test.