
Figures & data
Figure 1. Expression and effect of MALAT1 on cervical cancer cells in vitro.
(a) The expression of MALAT1 in tumor samples was analyzed. (b) The overall survival rate of patients with high and low MALAT1 expression was analyzed. (c) The expression level of MALAT1 was determined by RT-qPCR. Fold changes are shown using C33A cells as control. (d) HeLa and CaSki cells were transfected with NC and two specific siRNAs against MALAT1 (si1 and si2), and the expression of MATAL1 was measured using RT-qPCR. Quantitative data are shown. (e and f) Cells were treated the same as described in (d), and cell growth assay was performed at different time points, as indicated. (g-j) Cell migration and invasion assay were performed after transfection of siRNAs for MATAL1 in Hela and CaSki cells, respectively. The representative fields were photographed (G : migration, H: invasion) (scale bar: 100 μm), and the numbers of migrated and invaded cells were calculated. Three independent experiments were performed. NC, negative control.
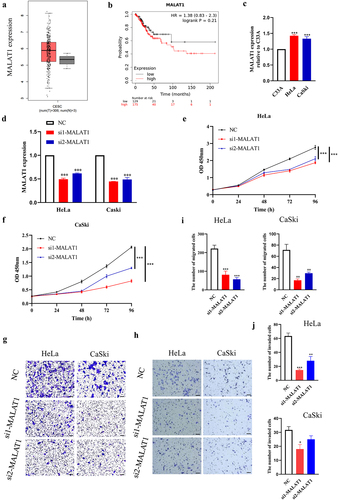
Figure 2. Effect of MATAL1 knockdown on cell proliferation and metastasis in vivo.
HeLa and CaSki cells were transfected with NC and siRNA against MATAL1, respectively, and labeled cells were then transplanted into larval zebrafish to evaluate cell proliferation and metastasis in vivo, as described in the Materials and methods section. (a and b) Representative photos of zebrafish injected with HeLa cells were taken using a confocal laser scanning microscope for each treatment. To quantify the proliferation and metastasis of injected cells, the zebrafish larvae were imaged with stereomicroscope. The fluorescence of HeLa cells that (c) resided in the fish yolk or (d) trunk was quantified using Image J software, and the values were normalized against those of the NC (n = 10). (e-h) Representative pictures (left panel) and quantified results (right panel) are shown for CaSki cells, as above (n = 10) (scale bar: 100 μm). NC, negative control.
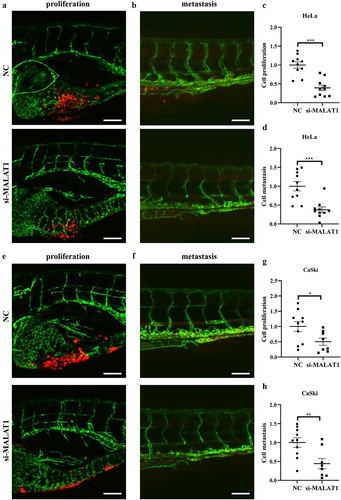
Figure 3. Effect of MATAL1on ALKBH5 expression in HeLa and CaSki cells.
(a and b) NC and two siRNA (si1 and si2) for silencing MALAT1 were transfected into HeLa and CaSki cells. The expression of the m6A-associated genes (METTL3, METTL14, WTAP, ALKBH5, and FTO) was determined by RT-qPCR. (c) The candidate miRNAs, which might bind to MALAT1 or ALKBH5, were predicted by StarBase. (d) Sequence of miR-141-3p was matched with MALAT1 and ALKBH5 3’UTR. (e) The expression of miR-141-3p was analyzed after knockdown of MALAT1 in HeLa cells. (f) The expression of miR-141-3p was analyzed after transient transfection of miR-141-3p mimics in HeLa cells using RT-qPCR. (g) The mRNA expression level of ALKBH5 was analyzed by RT-qPCR following transfection of miR-141-3p mimics in HeLa cells. (h) The cell lysates were subjected to western blot analysis for ALKBH5 expression after silencing MALAT1 using GAPDH as loading control. (i) The MALAT1 was overexpressed followed by analysis of ALKBH5 protein expression in HeLa and CaSki cells. NC, negative control.
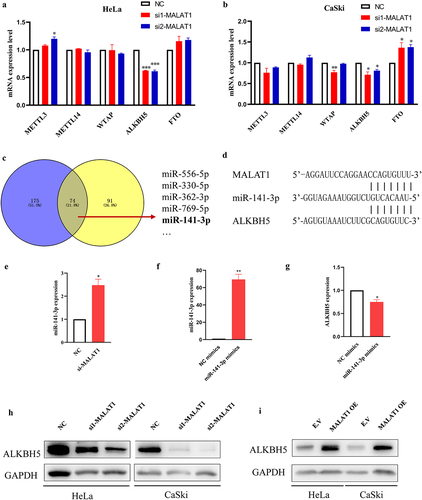
Figure 4. Effect of ALKBH5 on proliferation, migration and invasion in HeLa and CaSki cells.
HeLa and CaSki cells were transfected with NC and two siRNAs (si1 and si2) against the ALKBH5 gene. (a and b) The cells were harvested, and total RNA and protein were isolated. Total RNA was reverse-transcribed into cDNA for measuring ALKBH5 mRNA expression using RT-qPCR, and the lysates were subjected to western blot analysis using a specific antibody against ALKBH5 protein with GAPDH as the control. (c and d) Cell proliferation assay was performed at the indicated times for both HeLa and CaSki cells. (e) Cell migration and (f) invasion assays were performed. Representative fields were photographed (scale bar: 100 μm) (left panel), and the number of migrated and invaded cells was subsequently calculated (right panel). NC, negative control.
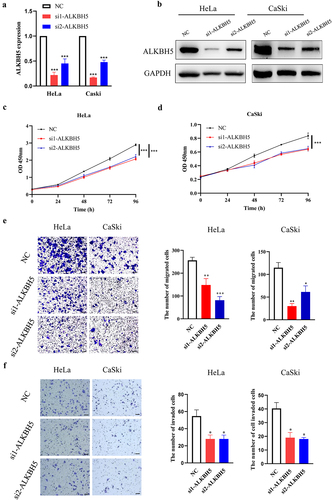
Figure 5. Effect of ALKBH5 on cell proliferation and metastasis in vivo.
HeLa and CaSki cells were transfected with NC and two siRNAs (si1 and si2) against the ALKBH5 gene, and labeled cells were transplanted into larval zebrafish to observe cell growth and metastasis. (a and b) Representative photos for proliferation (yolk) and metastasis (trunk) of HeLa cells in a zebrafish model taken by confocal laser scanning microscope are shown (scale bar: 100 μm). (c-f) The fluorescence of HeLa and CaSki cells in different sites of zebrafish was visualized by stereomicroscope and quantified using Image J software and normalized by negative control (n = 12). NC, negative control.
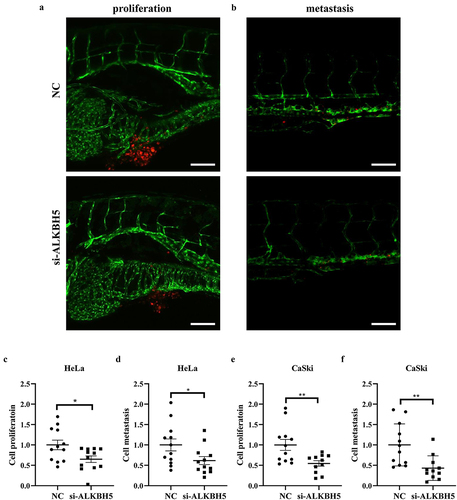
Figure 6. Effect of the MALAT1-ALKBH5 axis on MMP2 and MMP9 expression.
(a and b) HeLa and CaSki cells were, respectively, transfected with NC and two siRNAs against MALAT1 or ALKBH5. The expression levels of MMP2 and MMP9 was determined by RT-qPCR. (c) The cell lysates were subjected to western blot analysis of MMP2 and MMP9 after knockdown of MALAT1 in HeLa and CaSki cells using GAPDH as loading control. (d) Both HeLa and CaSki cells were transfected with NC and siRNAs against MALAT1 with co-transfection of the ALKBH5 expression vector (pcDNA3.1-ALKBH5), with empty vector (pcDNA3.1) serving as the control. Cell RNA was isolated and subsequently reverse transcribed into cDNA, which were subjected to RT-qPCR for determination of MMP2 and MMP9 expression using specific primers. NC, negative control.
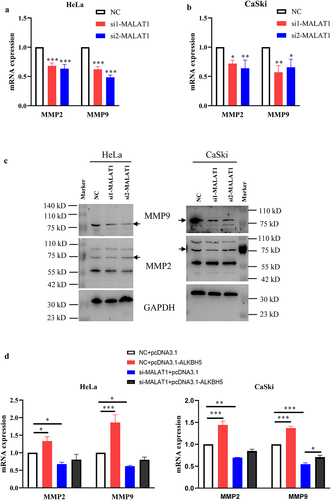
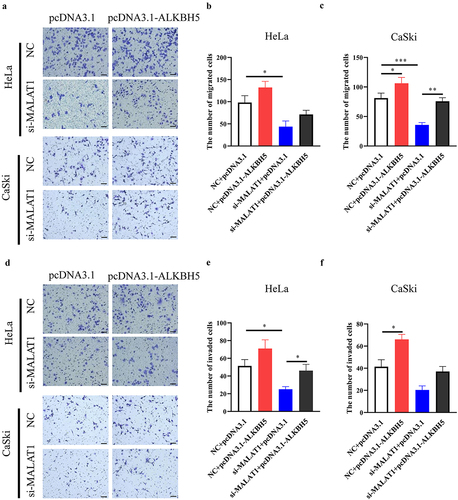
Figure 7. Effect of ALKBH5 on suppression of cell migration and invasion by silencing MALAT1.
Both HeLa and CaSki cells were transiently transfected with siMALAT1 and ALKBH5 expression vector alone or combination. (a-c) Cell migration assay was performed, and the representative fields were photographed (scale bar: 100 μm). The numbers of migrated cells were also counted based on three independent experiments. (d-f) Cell invasion assay was also performed, and the representative photos and the numbers of invaded cells are shown as described above.
Supplemental material