
Figures & data
Figure 1. BRG1 promotes HCC cell invasion. (a) HepG2 cells were transfected with pcDNA3.1 or BRG1 overexpression plasmid for 48 h, and then cell lysates were performed using western blot assay. (b) The gray blots were analyzed with ImageJ software (n = 3). **p < .01 vs pcDNA3.1-NC. (c) HuH-7 cells transfected with BRG1 plasmid were analyzed using western blot assay. (d) The gray blots were analyzed with ImageJ software (n = 3). ***p < .001 vs pcDNA3.1-NC. (e) The BRG1 siRNAs were designed and tranfected for 36 h into HepG2 cells, and then accessed using western blot assay. (f) The gray blots were analyzed with ImageJ software (n = 3). ***p < .001 vs siRNA-NC. (g) The knockdown effect of siRNA-BRG1 in HuH-7 cells were evaluate by western blot assay. (h) The gray blots were analyzed with ImageJ software (n = 3). ***p < .001 vs siRNA-NC. (i) Transwell assay was used to detect the invasion ability after BRG1 knockdown or overexpression in HepG2 cells. Scale bar, 50 μm. (j) Cells of different fields were randomly selected and counted (n = 3). ***p < .001 vs siRNA-NC, ###p < .001 vs pcDNA3.1-NC. (k) The invasion ability after BRG1 knockdown or overexpression in HuH-7 cells was detected by transwell assay. Scale bar, 50 μm. (l) Cells of different fields were randomly selected and counted (n = 3). ***p < .001 vs siRNA-NC, ###p < .001 vs pcDNA3.1-NC.
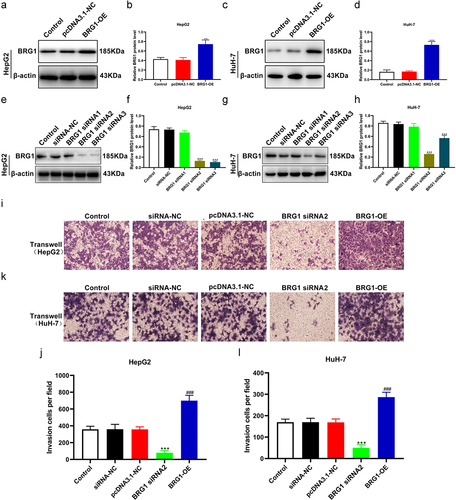
Figure 2. BRG1 affects HCC cell migration. (a) Wound healing assay was used to evaluate the migration ability at 48 h after BRG1 knockdown or overexpression in HepG2 cells. Scale bar, 200 μm. (b) Different fields of cells were randomly selected, and then wound size was calculated (n = 3). ***p < .001 vs siRNA-NC, ##p < .01 vs pcDNA3.1-NC. (c) The migration ability after BRG1 knockdown or overexpression in HuH-7 cells was evaluated by wound healing assay. Scale bar, 200 μm. (d) Different fields of cells were randomly selected, and then wound size was calculated (n = 3). ***p < .001 vs siRNA-NC, #p < .05 vs pcDNA3.1-NC.
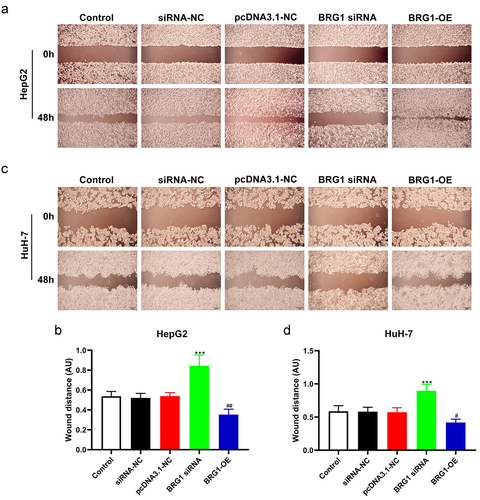
Figure 3. BRG1 inhibits HCC cell apoptosis. (a) HepG2 cells were transfected with BRG1 siRNA or overexpression plasmid, respectively, and then stained with both YO-PRO-1 and PI dye. Scale bar, 50 μm. (b) The proportion of green-labeled apoptotic cells were measured accroding to randomly selected cell fields (n = 5). ***p < .001 vs siRNA-NC, ###p < .001 vs pcDNA3.1-NC. (c) HuH-7 cells transfected with BRG1 siRNA or overexpression plasmid were stained with both YO-PRO-1 and PI dye, respectively. Scale bar, 50 μm. (d) The proportion of apoptotic cells were measured (n = 5). ***p < .001 vs siRNA-NC, ###p < .001 vs pcDNA3.1-NC.
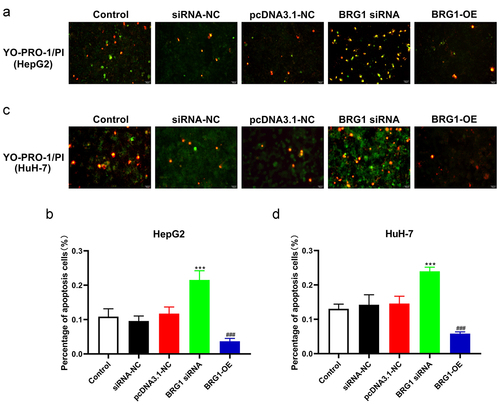
Figure 4. BRG1 increases HCC cell colony formation. (a) Colony formation assay was used to evaluate the colony formation ability after BRG1 knockdown or overexpression in HpG2 cells. (b) The stained colonies were photographed and counted (n = 5). ***p < .001 vs siRNA-NC, ###p < .001 vs pcDNA3.1-NC. (c) The colony formation ability after BRG1 knockdown or overexpression in HuH-7 cells was examined. (d) The stained colonies were photographed and counted (n = 5). ***p < .001 vs siRNA-NC, ###p < .001 vs pcDNA3.1-NC.
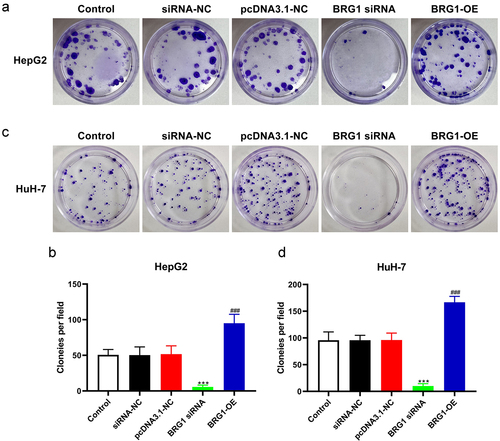
Figure 5. BRG1 alters the membrane potential ΔΨm of HCC cells. (a) MPP assay was used to analyze membrane potential ΔΨm, and then HepG2 cells were stained with JC-1 probe after BRG1 knockdown or overexpression. Scale bar, 50 μm. (b) The relative ratio of the red fluorescence intensity to the green fluorescence intensity was determined (n = 5). ***p < .001 vs siRNA-NC, ###p < .001 vs pcDNA3.1-NC. (c) HuH-7 cells with treatment were stained with JC-1 probe. Scale bar, 50 μm. (d) The relative fluorescence intensity was determined by ImageJ software (n = 5). ***p < .001 vs siRNA-NC, ###p < .001 vs pcDNA3.1-NC.
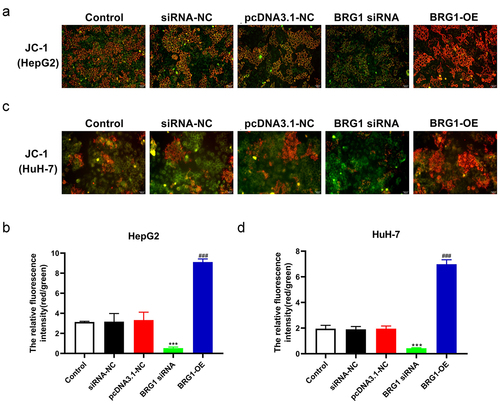
Figure 6. BRG1 regulates the opening of mitochondrial permeability transition pore of HCC cells. (A) HepG2 cells were stained with Calcein AM after BRG1 knockdown or overexpression. Scale bar, 20 μm. (B) Fluorescence intensity of different treatment groups was determined (n = 5). ***p < .001 vs siRNA-NC, ##p < .01 vs pcDNA3.1-NC. (C) HuH-7 cells with treatment were stained with Calcein AM. Scale bar, 20 μm. (D) Fluorescence intensity of different treatment groups was determined (n = 5). **p < .01 vs siRNA-NC, ###p < .001 vs pcDNA3.1-NC.
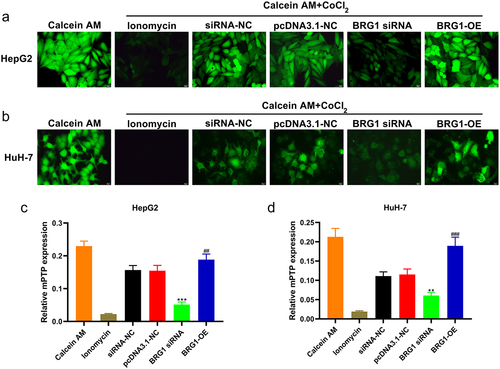
Figure 7. BRG1 induces the expession of TOMM40 in HCC cells. (a) HepG2 cells were stained with TOMM40 and BRG1 antibody after BRG1 knockdown or overexpression. (b and c) the percentage of positive cells was analyzed by ImageJ software (n = 10). **p < .01, ***p < .001 vs siRNA-NC, ##p < .01, ###p < .001 vs pcDNA3.1-NC. (d) HuH-7 cells were stained with TOMM40 and BRG1 antibody after BRG1 knockdown or overexpression. (e and f) the percentage of positive cells was analyzed by ImageJ software (n = 10). ***p < .001 vs siRNA-NC, ##p < .01, ###p < .001 vs pcDNA3.1-NC.
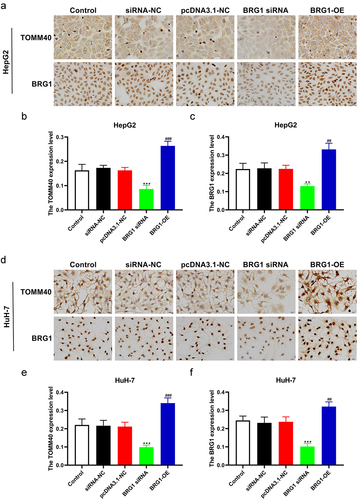
Figure 8. BRG1 induces the expession of TOMM40 in HCC cells. (a) HepG2 cells were immunostained with TOMM40 and BRG1 antibody after BRG1 knockdown or overexpression. Scale bar, 20 μm. (b and c) the relative fluorescence intensity was analyzed by ImageJ software (n = 10). ***p < .001 vs siRNA-NC, ##p < .01, ###p < .001 vs pcDNA3.1-NC. (d) HuH-7 cells were immunostained with TOMM40 and BRG1 antibody after BRG1 knockdown or overexpression. Scale bar, 20 μm. (e and f) the relative fluorescence intensity was analyzed by Image J software (n = 10). ***p < .001 vs siRNA-NC, ###p < .001 vs pcDNA3.1-NC.
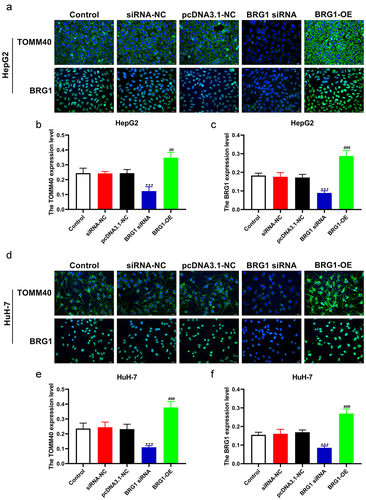
Figure 9. BRG1 activates TOMM40/ATP5A1 pathway in HCC cells. (a) The expressions of BRG1, TOMM40 and ATP5A1 were analyzed using Western blotting after BRG1 knockdown or overexpression in HepG2 cells. (b-d) the relative intensities of BRG1, TOMM40 and ATP5A1 were determined using ImageJ software (n = 3). **p < .01, ***p < .001 vs siRNA-NC, ##p < .01, ###p < .001 vs pcDNA3.1-NC. (e) The expressions of BRG1, TOMM40 and ATP5A1 were analyzed using Western blotting after BRG1 knockdown or overexpression in HuH-7 cells. (f-h) the relative intensity were determined using ImageJ software (n = 3). **p < .01, ***p < .001 vs siRNA-NC, ###p < .001 vs pcDNA3.1-NC. (i-l) the mRNA expressions level of BRG1, TOMM40 and ATP5A1 were analyzed using RT-qPCR.(n = 3). ##p < .01, ###p < .001 vs siRNA-NC, ***p < .001 vs pcDNA3.1-NC.
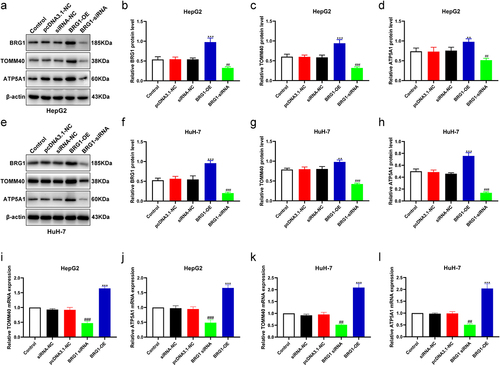
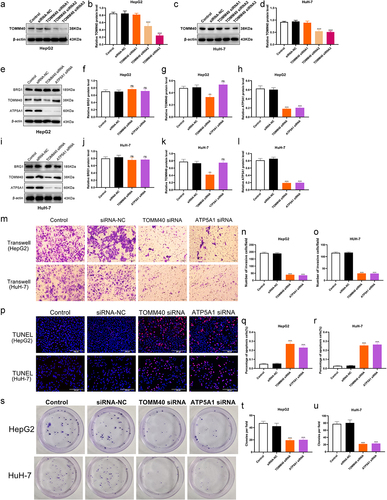
Figure 10. TOMM40 and ATP5A1 on cell growth, apoptosis and invasion. (a, c) HCC cells were transfected with TOMM40 siRnas, and then cell lysates were performed using Western blotting. (b, d) the relative expression of TOMM40 were determined by ImageJ software (n = 3). ***p < .001 vs siRNA-NC. (e, i) the expressions of BRG1, TOMM40 and ATP5A1 were analyzed using Western blotting after TOMM40 and ATP5A1 knockdown in HepG2 and HuH-7 cells. (f-h, j-l) the relative intensity of blots was determined using ImageJ software (n = 3). ns: not significant, **p < .01, ***p < .001 vs siRNA-NC. (m-o) Transwell assay was used to detect the invasion ability after TOMM40 or ATP5A1 knockdown in HCC cells. Scale bar, 50 μm. (n = 3). (p-R) TUNEL assay was used to detect the proportion of apoptotic cells after TOMM40 or ATP5A1 knockdown in HCC cells. Scale bar, 200 μm. (n = 3). (s-u) Colony formation assay was used to evaluate the colony formation ability after TOMM40 or ATP5A1 knockdown in HCC cells. (n = 3). ***p < .001 vs siRNA-NC.
Supplemental Material
Download MS Word (14.7 KB)Supplementary Figure.jpg
Download JPEG Image (2.6 MB)
Data availability statement
The datasets generated during and analyzed during the current study are available from the corresponding author on reasonable request.