
Figures & data

Figure 1. The division of prefecture-level and above cities in different regions and city sizes in China. The four regional division (eastern, central, western and northeastern regions) was obtained from the classification scheme of the National Bureau of Statistics, the values represent the number of cities in each region.
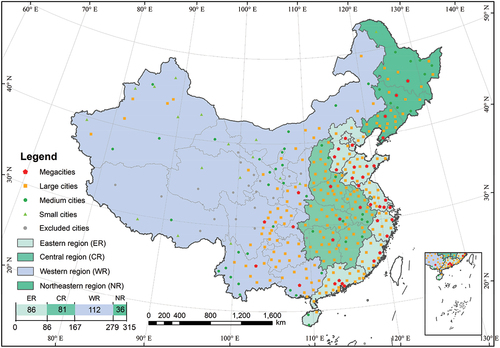
Table 1. Data sources and descriptions.
Figure 2. The methodological workflow of the study.
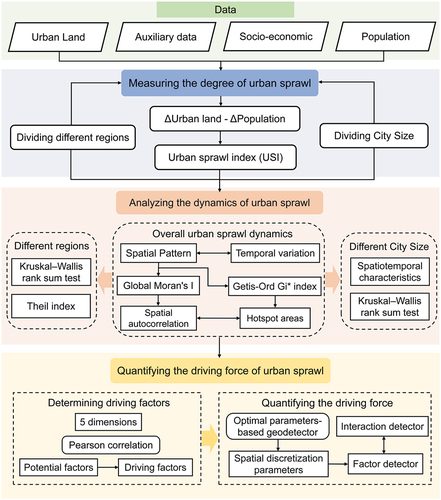
Table 2. Selected driving factors of urban sprawl in China.
Figure 3. The values of urban sprawl index (USI) of 315 cities in China during 2000 ~ 2020.
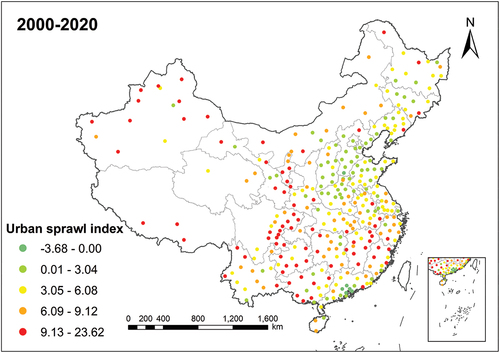
Figure 4. Dynamics of urban sprawl measured by urban sprawl index (USI) during the (a) 2000~2010 and (b) 2010~2020 periods.
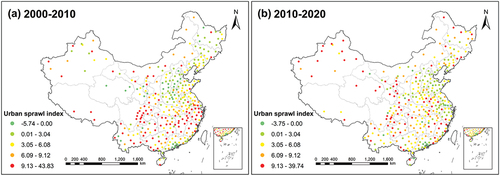
Figure 5. Variations in urban sprawl among different regions: (a) urban sprawl index in different regions during 2000 ~ 2020 (note: the box plot displays the average, the median, the first and third quartiles of urban sprawl index); (b) the proportion of cities with varying urban sprawl values relative to the national averages.
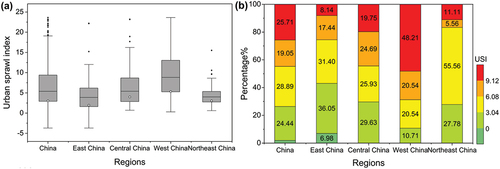
Figure 6. Variations in urban sprawl among different regions: (a) and (c) average urban sprawl index (USI) in different regions during 2000~2010 and 2010~2020, respectively; (b) and (d) the proportion of cities with varying urban sprawl values relative to the national averages during 2000~2010 and 2010~2020, respectively.
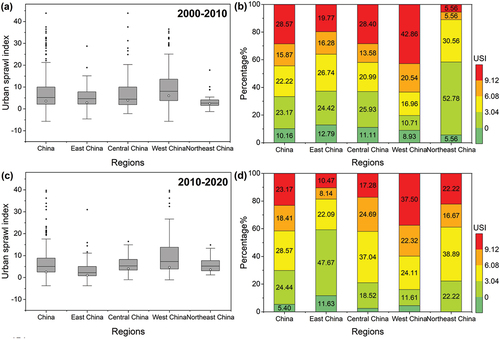
Table 3. Theil value of the urban sprawl index and the contributions of interregional and intraregional urban sprawl in China at different periods.
Figure 7. Spatial clusters of urban sprawl detected by Getis-Ord Gi* during the (a) 2000~2020; (b) 2000~2010; and (c) 2010~2020 period.
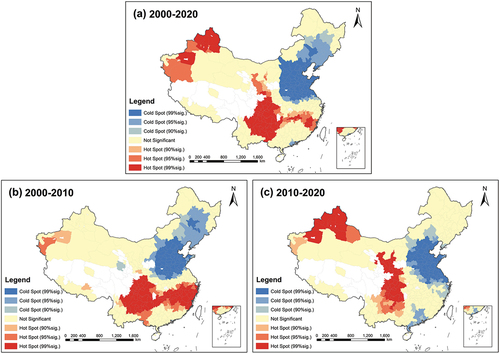
Figure 8. The average urban sprawl index obtained at different city scales during the (a) 2000~2020; (b) 2000~2010 and 2010~2020 periods.
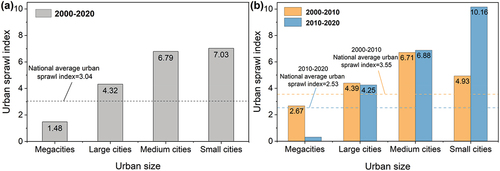
Figure 9. Driving factors of urban sprawl based on the factor detection method: explanatory powers of driving factors during (a) 2000~2020; (b) 2000~2010 and 2010~2020; and (c) driving forces of urban sprawl from different dimensions.
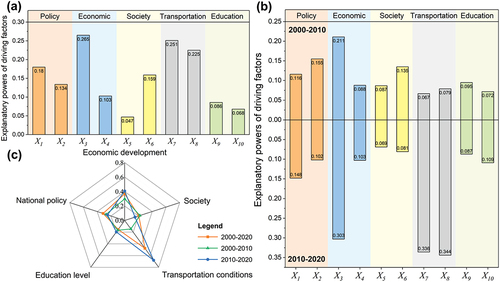
Figure 10. Driving factors of urban sprawl during 2000~2020 based on the interactive detection of geodetector (the value represents the interactive effect of a combinations of factors, e.g. 0.461 for the combination of X1 and X5 on urban sprawl).
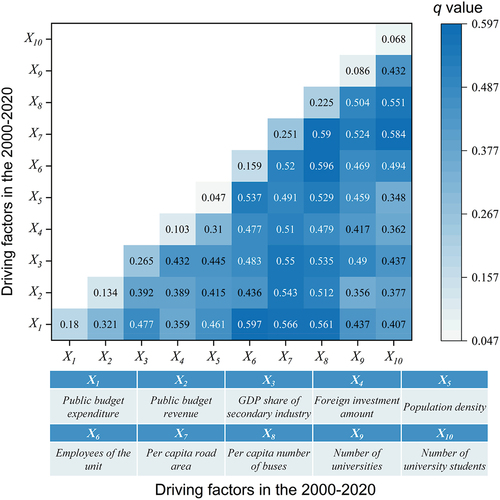
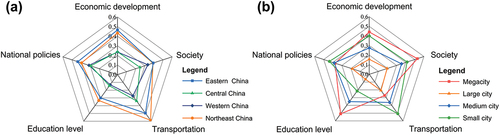
Figure 11. The driving forces of urban sprawl in (a) different regions; and (b) different city sizes.
Graphical Abstract.png
Download PNG Image (2.8 MB)
Supplementary Material.docx
Download MS Word (2.2 MB)Data availability statement
The urban area data used in this study can be accessed through the National Tibetan Plateau Scientific Data Center, which were derived from the Chinese urban built-up area dataset (1992 ~ 2020)V1.0 (https://doi.org/10.11888/HumanNat.tpdc.272851).The socio-economic data was available at the China City Statistical Yearbook (https://data.cnki.net/yearBook/). The urban population data from population census data can be obtained through https://www.stats.gov.cn/sj/pcsj/. The geographic auxiliary data can be accessed through the National Geomatics Center of China (http://bzdt.ch.mnr.gov.cn/). The data that support the findings of this study are available from the corresponding author upon reasonable request.