Figures & data
Figure 1. Transcriptional expression and autophagy activity were significantly enhanced after V. dahliae (V592) challenge in wild-type Arabidopsis. (A) Time-course gene expression profile of selected autophagy genes. Hai, hours after inoculation. (B) GFP-ATG8E-labeled autophagosome-like structures at 24, 48, 72 and 96 Hai in wild-type and atg10-1 plants. Bar: 10 μm. (C) Quantification of GFP-ATG8E-labeled autophagosome-like structures. Mean and standard error (SE) were calculated from 15 primary roots from GFP-ATG8E transgenic seedling per time point, and similar results were obtained in 3 independent experiments with roughly 150 investigated cells per time point. WT, wild type. Mock-inoculated controls at 48 Hai were shown as representatives for (B) and (C) because no obvious difference was observed between the mock controls at 24, 48 and 72 Hai. “*” and “**” indicate statistically significant (P ≤ 0.05 or P ≤ 0.01 vs mock), measured by the Student t test.
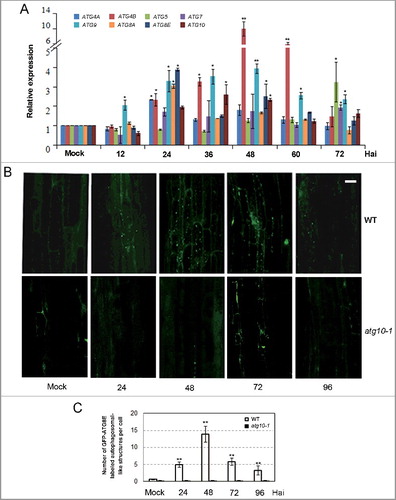
Figure 2. Defective autophagy caused higher susceptibility of Arabidopsis plants to V. dahliae (V592) infection. (A) The disease symptom was more serious in autophagy mutants atg5, atg7 and atg10-1 compared with WT. Bar: 1 cm. (B) Comparison of healthy leaf areas for the WT and atg10-1 mutant Arabidopsis plants. “*” and “**” indicate statistically significant (P ≤ 0.05 or P ≤ 0.01 vs mock). (C) Comparison of the V. dahliae DNA levels in V. dahliae-infected WT and autophagy mutants atg5, atg7 and atg10-1. WT, wild type. “*” and “**” indicate statistically significant (P ≤ 0.05 or P ≤ 0.01 vs WT), measured by the Student t test.
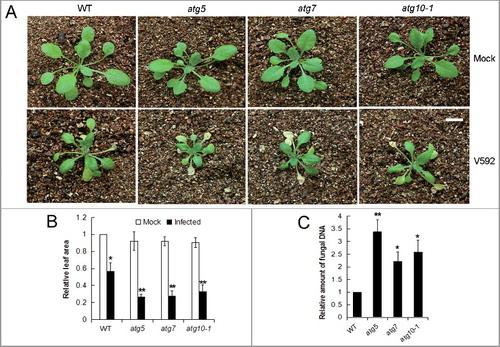
Figure 3. iTRAQ-based proteomics identification of proteins in response to V. dahliae infection in the wild-type and atg10-1 Arabidopsis plants. (A) Venn diagram showing the distribution of the number of proteins that were identified from 3 biological repeats. (B) Venn diagram showing the overlap of up- and down-accumulated proteins identified in the WT and atg10-1 mutant. (C and D) Comparison of the number distributions of upaccumulated (C) and downaccumulated (D) proteins identified from the WT and atg10-1 according to the time course. w+/m−, w−/m+ and w+/m+D indicate the same meaning mentioned in the text. w+/m+D (w) indicate proteins both changed, and preferentially changed in WT at more time-points or with higher abandance; w+/m+D (m) indicate proteins both changed, and preferentially changed in mutant at more time-points or with higher abundance. WT, wild type.
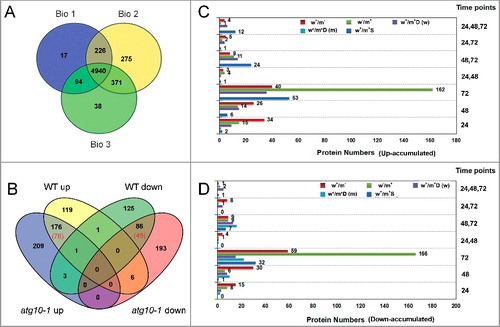
Figure 4. Verification of the accumulation patterns of iTRAQ identified proteins. (A) Western blot analysis of several V. dahliae-responsive proteins in the roots of wild-type and atg10-1 Arabidopsis plants. CBB, Coomassie Brilliant Blue staining of the gel to show equal loading of proteins. (B) Heat map showing the accumulation changes of selected proteins. Blank spaces are representative of a protein that was identified but did not have a significant change in accumulation relative to the control, M indicated comparison of the 2 mock controls, the fold change was obtained relative to the WT control. (C to M) qRT-PCR analysis of the transcription levels of some selected proteins. The vertical axis in the panels indicates the relative expression change versus mock control of WT. Standard deviation (n = 3) was estimated. “*” and “**” indicate statistically significant (P ≤ 0.05 or P ≤ 0.01 versus mock), “#” and “##” indicate statistically significant (P ≤ 0.05 or P ≤ 0.01 vs atg10-1), measured by the Student t test.
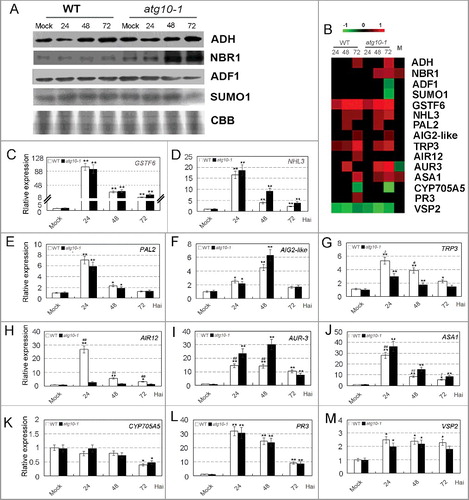
Figure 5. Brief graphic result showing the GO annotation of proteins identified with the agriGO tool. (A) Biological process. (B) Cell component.
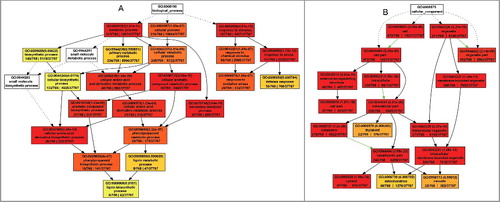
Figure 6. Autophagy is involved in the activation of defense responses against V. dahliae infection. (A) Classification of proteins that were annotated as defense response. (B) Heat map showing the accumulation change pattern of proteins that were annotated as defense response at different time points upon V. dahliae infection in comparison with mock inoculation. Blank space and letter M in this panel have the same meaning as that of B. (C) Schematic representation of the functional cascade and subcellular localization for the proteins whose V. dahliae responses were absent or postponed because of defective autophagy: ① When a pathogen infected a cell, an unknown PAMP activated its receptor, it triggered an ROS burst generated by RBOHD, and the burst signaling provoked HR cell death and cell wall reinforcement. ② The interaction of the elicitor peptide and its receptors activated calmodulin-like proteins and mediated NO generation that caused cell wall reinforcement. ③ MLP, Mediator 21 and RD19 mediated the transcriptional activation of the downstream defense response. ④ NHL10 mediated cell death. ⑤ WHY2 protein repaired DNA double-stranded breaks over an error-prone repair pathway in mitochondria. ⑥ thioredoxin, ATGSH1 and class III peroxidases mediated H2O2 homeostasis regulation in plant defense.
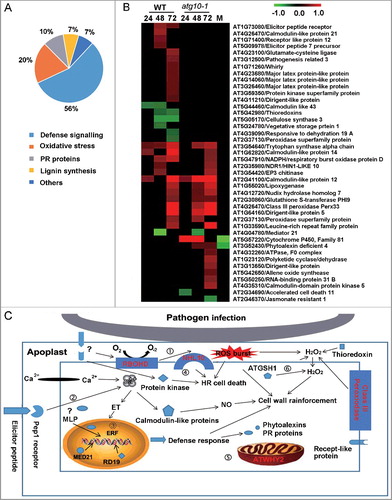
Figure 7. Mitophagy-mediated plant defense against V. dahliae infection by removing dysfunctional mitochondria. (A) Heat map showing the annotated mitochondria-localized proteins. Blank space and letter M in this panel have the same meaning as that of B. (B) Colocalization of mitochondria and autophagosome-like structures in V. dahliae-infected transgenic Arabidopsis seedlings expressing both Mito-YFP and mCherry-ATG8E. The mature region of mock or inoculated primary root (upper 2 panels) or root hair (lower 2 panels) was imaged at 48 Hai by confocal fluorescence microscopy. Bar: 5 μm. (C) Quantification of colocalized puncta labeled by both Mito-YFP and mCherry-ATG8E. Mean and standard error (SE) were calculated from 15 mock or inoculated primary roots from transgenic seedlings, and similar results were obtained in 3 independent experiments which examined approximately 150 cells. “**” indicate statistically significant (P ≤ 0.01 vs mock), measured by the Student t test.
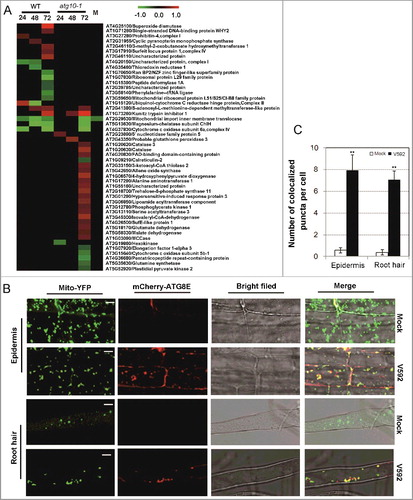
Figure 8. TEM analysis of the mitophagy activation in Arabidopsis root cells challenged by V. dahliae. (A and B) Representative TEM images of the mock or inoculated root cells of WT and atg10-1 at 48 Hai. (A) Cortex cell. (B) Perivascular cell. a to d, enlarged images of the square in the middle panel. Arrows in “a” and “c” indicate mitophagosomal-like structures, arrow heads highlight the double membrane of the mitophagosomal-like structures. (C) Quantification of mitophagosome-like structures observed in TEM images of mock or V592 inoculated root cells in wild-type and atg10-1 plants. E/C, epidermis and cortex; P-V, perivascular. Bar = 0.5 µm for (A and B); bar: 0.2 µm for (a to d). WT, wild type. “**” indicate statistically significant (P ≤ 0.01 vs mock), measured by the Student t test, “##” indicate statistically significant (P ≤ 0.01 vs atg10-1), measured by the Student t test. Mean and standard error (SE) were calculated from 10 independent areas of 100 µm2.
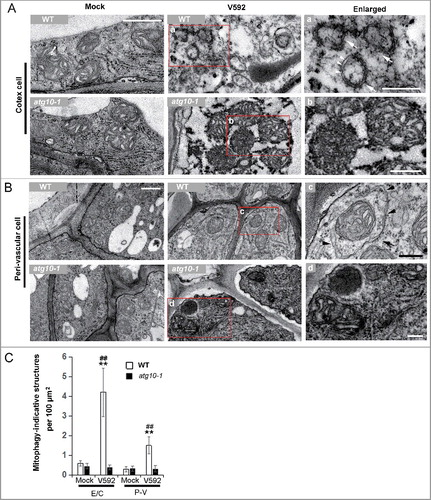
Figure 9. Autophagy defects attenuate xylem cell lignification in response to V. dahliae infection in Arabidopsis. (A) Heat map showing the accumulation change of proteins annotated as phenylpropanoid metabolism process. Blank space and letter M have the same meaning as those in B. (B) Quantification of lignin content in WT and atg10-1 upon V. dahliae infection at 7, 14, 21 and 28 dpi. (C to E) Quantification of lignin intermediates in the WT and atg10-1 upon V. dahliae infection at 28 dpi. (F) Xylem hyperplasia was significantly attenuated in atg10-1 compared with those of the WT at 28 dpi, BF, bright field, AU, autofluorescence, Bar: 200 μm. (G and H) qRT-PCR quantification of the transcriptional level of VND 7 (G) and HB8 (H) corresponded to the enhancement of xylem formation. WT, wild type. “*” and “**” indicate statistically significant (P ≤ 0.05 or P ≤ 0.01 vs mock), “#” and “##” indicate statistically significant (P ≤ 0.05 or P ≤ 0.01 vs atg10-1) measured by the Student t test.
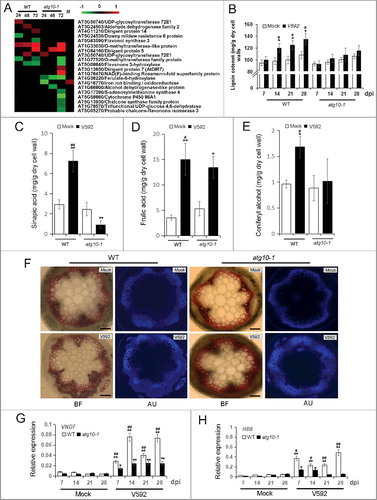
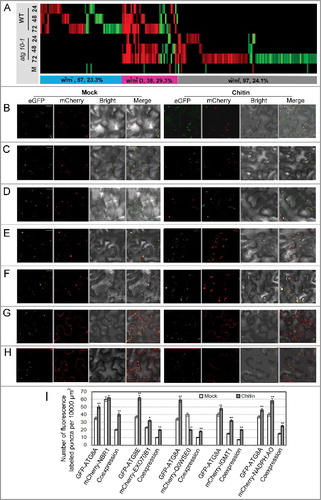
Figure 10. In silico prediction and experimental validation of representative ATG8-family-interacting proteins from the differentially accumulated proteins. (A) Heat map showing the accumulation changes of the predicted ATG8-family-interacting proteins upon V. dahliae infection, numbers of the predicted ATG8-family-interacting proteins and their proportion in total w+/m−, w+/m+D and w−/m+ proteins were shown in the colored rectangle; w+/m−, w−/m+ and w+/m+D indicate the same meaning mentioned in the text. Blank space and letter M have the same meaning as those in B. (B to H) Transient coexpression of GFP-ATG8A/8E (B, D to H, GFP-ATG8A; C, GFP-ATG8E) with mCherry-labeled ATG8-family-interacting proteins in N. benthamiana. (B) AT4G24690 (NBR1, Q9SB64). (C) AT5G58430 (EXO70B1, Q9FGH9). (D) AT3G06035 (Unknown protein, Q0WSE0). (E) AT1G21100 (IGMT1, Q9LPU5). (F) AT4G32360 (NADPH:AO, Q8W3L1). (G) AT5G13370 (GH3, Q8GZ29). (H) AT1G78870 (UBC13A, Q94A97). ATG8 proteins labeled by GFP (green); tested proteins labeled by mCherry (red); colocalization (yellow). Bar: 10 μm. (I) Quantification of numbers of fluorescence-labeled puncta for proteins colocalized with ATG8. “*” and “**” indicate statistically significant (P ≤ 0.05 or P ≤ 0.01 vs mock), measured by the Student t test.