Figures & data
Figure 1. Detection of novel Atg8-positive membrane structures in atg mutants using anti-Atg8 and anti-Ape1 antibodies. (A to F) atg2∆, (G to I) atg9∆, (J) atg14∆, (K and L) atg18∆, and (M and N) atg2∆ cells were grown in YPD to mid-log phase and shifted to SD-N medium for 3 h, then processed for IEM. Sections were stained with anti-Atg8 (A to L) or anti-Ape1 (M and N) antibodies. (F) A schematic model corresponding to (E). No. 1 means Atg8-positive membrane structure (subsequently an alphasome). No. 2 means tubular membrane structure. A part of the structure shows ribosome-bound membrane. Large arrows mark Atg8-positive membranes, and arrowheads point to tubular membrane structures. Small arrows mark Ty1 VLPs. G, gold particle; N, nucleus; R, ribosome; V, vacuole; VLP, virus-like particle. Scale bars: 100 nm.
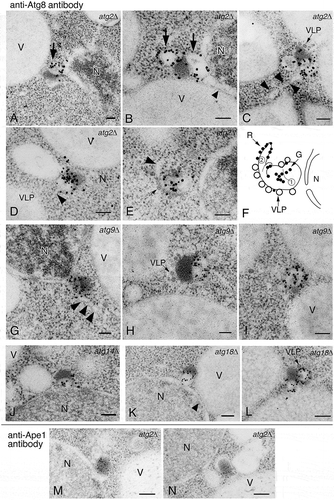
Figure 2. Localization of Atg8–PE in atg1∆ cells stained with anti-Atg8 antibody. Cells were grown in YPD to mid-log phase and shifted to SD-N medium for 3 h, then processed for IEM as in . The electron dense core of the Cvt complex, comprised primarily of prApe1, is marked with an arrow. V, vacuole. Scale bar: 100 nm.
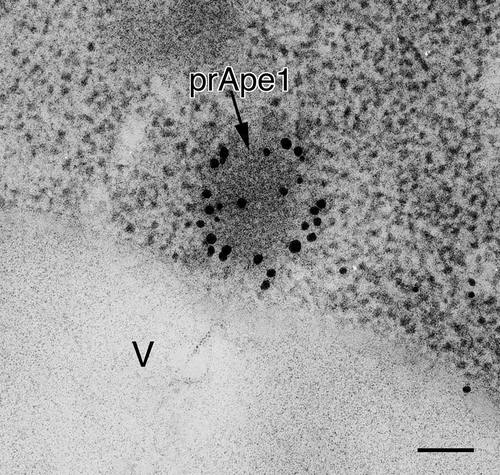
Figure 3. Ultrastructure of the Atg8–PE-containing compartments induced under nitrogen starvation conditions. (A) atg1∆, (B and C) atg2∆, (D) atg14∆, (E) atg9∆, and (F and G) atg18∆ cells were grown in YPD to mid-log phase and shifted to SD-N medium for 3 h. (H) atg18∆ cells were grown in YPD. The white arrow (A) marks the Cvt complex. Black and white arrow (B and F) marks the protrusion from the nuclear membrane. Arrowheads (A, C, D and H) point to Ty1 VLPs, and arrows (C and F) mark ribosome-attached, rER-like membrane. Scale bars: 100 nm. N, nucleus; V, vacuole.
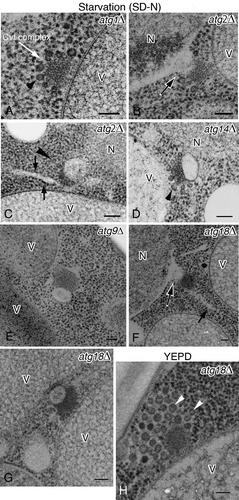
Figure 4. Live-cell imaging of GFP-Atg8 in WT, atg14∆, and atg9∆ cells. (A) Typical localization images of GFP-Atg8 in cells divided into 3 catogories. (B) Percentages are shown as the mean ± SD of 3 independent experiments. For NN, P < 0.005 (WT vs atg9∆); P < 0.05 (WT vs atg14∆). Cells were grown in YPD medium to mid-log phase and then shifted to SD-N medium for 3 h. NN; next to the nuclear membrane. I; intermediate area between nucleus and vacuole. PV; proximity to the vacuolar membrane. Scale bars: 500 nm.
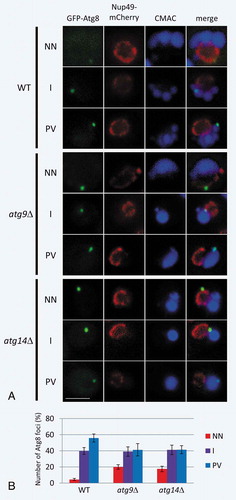
Figure 5. 3D reconstruction analysis of an alphasome and the Cvt complex in atg14∆ (A to G) and atg9∆ (H to K) cells. (A to D) Cross-section images of a 3D reconstruction derived from a 150-nm serial section. (E) Texture map corresponding to (D). (F) Volume rendering model corresponding to (E). Pink shows all membrane structures around the Cvt complex. (G) 3D model derived from tomogram and texture map. The color shows rER-like and tubular membrane structure (pink), the nuclear membrane (green; the small rounded structures on this membrane represent ribosomes), the hemispherical structure (the alphasome, yellow) on the nuclear membrane, the core of the Cvt complex (red) and Ty1 VLPs (purple). (H to J) Cross-section images in a 3D reconstruction from a 400-nm section. (K) 3D model derived from tomography. Cells were grown in YPD to mid-log phase and shifted to SD-N medium for 3 h. Large white arrow (A) marks the Cvt complex. Large arrowheads and white arrow (A and B) mark an alphasome and Ty1 VLPs, respectively. The white arrowheads (C to F) point to the apparent continuity between the alphasome and nuclear membrane lumen. rER-like structure (C and D) marked by black arrows. The white double arrow (D, E, and G) notes the continuity between the alphasome and rER-like structure. The white arrow (F) points to the hemisphere-shaped alphasome. The arrow (H) notes an rER-like structure originated from the nuclear membrane. The arrowhead in (I) points to the continuity between the alphasome and nuclear membrane lumen. The arrowhead (J and K) notes the continuity between the alphasome and rER-like structure. The white arrows (G and K) mark ribosomes. Scale bars: 100 nm. N, nucleus; NM, nuclear membrane; rER, rough endoplasmic reticulum; V, vacuole.
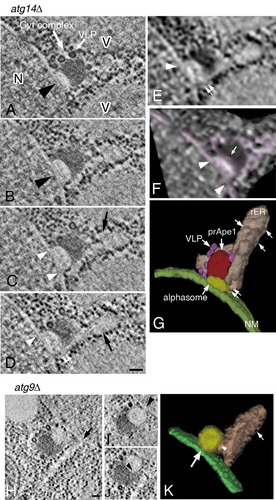
Figure 6. 3D analysis of an alphasome and the peripheral membrane structure in atg9∆ cells. (A) TEM image of a 400-nm thick section. (B to E) Cross-section (X-Y plane) images of 3D reconstruction and corresponding texture map (F to I). (J to M) 3D models. Cells were grown in YPD to mid-log phase and shifted to SD-N medium for 3 h. The colors show an alphasome and rER-like structure (yellow), nuclear membrane (green), prApe1 presumably bound to Atg19 (Cvt complex; red) and Ty1 VLPs (purple). Red arrowheads (A) indicate the membrane structure area around the core of the Cvt complex. Red plus (B and C) mark alphasomes. Blue arrowheads mark the tubular membrane structure (B, D, F, H, J, L and M). The yellow arrows (A, D and E) point to the connection between the nuclear membrane and rER-like membrane. The green arrowheads (C to I) note the continuity of the lumens, and purple arrowheads mark Ty1 VLPs (B to E, J and M). The white arrow (C, J, K and M) points to ribosomes attached to the membrane. The white double arrows (M) show a tubular membrane structure decorated with ribosomes. Scale bars: 100 nm. L, lipid droplet; N, nucleus; NM, nuclear membrane; V, vacuole.
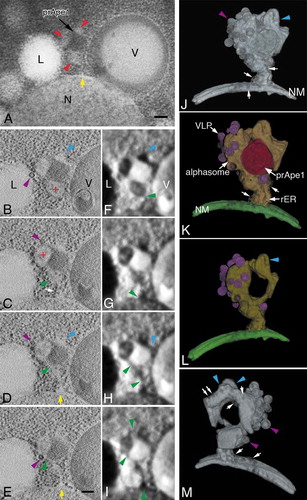
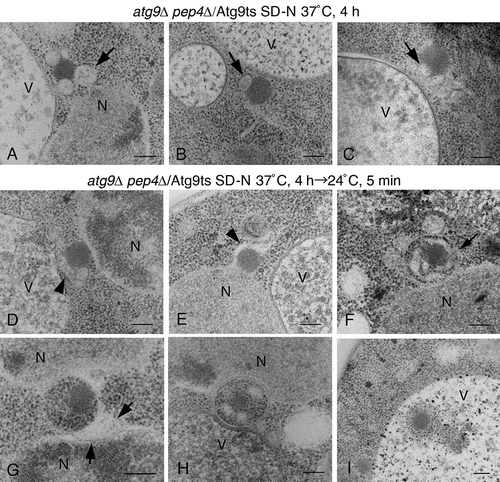
Figure 7. The detection of the alphasome and autophagosome in atg9∆ pep4∆ cells expressing Atg9ts. (A to C) Cells were grown in SD selective media to mid-log phase at permissive temperature (24°C), and then shifted to SD-N medium at 37°C for 4 h. (D to I). After the shift up to 37°C in SD-N medium for 4 h, the cells were shifted down to 24°C in SD-N medium for 5 min. The arrows (A to C) point to alphasomes. The arrowheads (D and E) show the elongated membrane sac. The arrows (F and G) point to the lumen of an autophagosome. Scale bars: 200 nm. N, nucleus; V, vacuole.