Figures & data
Figure 1. eGFP-Map1lc3b in Tg(elavl3:eGFP:map1lc3b)la50016± is expressed throughout the nervous system. (a-e) Dorsal views of representative confocal images of Tg(elavl3:eGFP:map1lc3b)la50016± embryos/larvae at indicated developmental stages. Some autofluorescence from the skin is visible in (c-e). Scale bars: 100 μm. (a’-e’) Lateral views of representative reconstructed confocal tile-scan images of Tg(elavl3:eGFP:map1lc3b)la50016± embryos/larvae at the indicated developmental stages. Dotted lines outline the indicated structures. dd, dorsal diencephalon; e, eye; hb, habenula; nt, neural tube; ot, optic tectum; tel, telencephalon. Scale bars: 500 μm.
Figure 2. eGFP-Map1lc3b puncta are induced by rapamycin and P/E, and inhibited by 3-methyladenine treatment. (a) Representative maximum confocal projections of the optic tectum regions of 3-dpf larvae that underwent indicated treatment for 24 h. Arrowheads indicate examples of puncta. (b) Quantification of the numbers of eGFP-Map1lc3b-positive puncta in the optic tectum of 3-dpf larvae that underwent the indicated treatment for 24 h; mean ± s.e.m. shown; n ≥ 13 for each group. Results from BafA-treated groups are reported in Fig. S2.
Figure 3. Colocalization of autophagosomes and lysosomes. (a) Representative confocal z-sections of the optic tectum regions of 3-dpf larvae that underwent the indicated treatment for 24 h followed by 1 h of LysoTracker Red staining. Arrowheads indicate examples of puncta that are double positive for both eGFP-Map1lc3b and LysoTracker Red, i.e. autolysosomes. Scale bars: 10 μm. (b) Percentage of eGFP-Map1lc3-positive puncta that colocalize with LysoTracker Red-positive puncta; mean ± s.e.m. shown; n ≥ 40 for each group. ****p < 0.0001, ***p < 0.001, **p < 0.01, *p < 0.05, p > 0.05 (n.s.), one-way ANOVA with Tukey’s multiple comparison analysis (GraphPad Prism) .
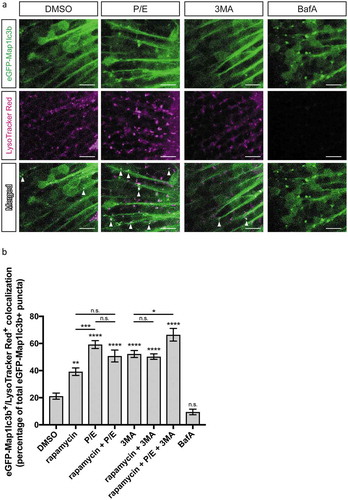
Figure 4. Rate of eGFP-Map1lc3b-positive puncta accumulation is higher in rapamycin-treated samples. Rates of eGFP-Map1lc3b-positive puncta accumulation in the optic tectum of 3-dpf larvae that underwent indicated treatment for 24 h over 60 min were obtained via addition of BafA under the indicated drug treatment (see Materials and Methods). Mean ± s.e.m. shown; n ≥ 12 for each group. **p < 0.01, p > 0.05 (n.s.), one-way ANOVA with Dunnett’s multiple comparison analysis (GraphPad Prism) .
Figure 5. Isradipine does not induce autophagosome formation nor alter autophagic flux. (a) Representative maximum confocal projections of the optic tectum regions of 3-dpf larvae that underwent indicated treatment for 24 h. Scale bars: 10 μm. (b) Quantification of the numbers of eGFP-Map1lc3b-positive puncta in the optic tectum of 3-dpf larvae that underwent indicated treatment for 24 h; mean ± s.e.m. shown; n ≥ 12 for each group. ****p < 0.0001, *p < 0.05, p > 0.05 (n.s.), one-way ANOVA with Tukey’s multiple comparison analysis (GraphPad Prism). (c) Quantification of rate of eGFP-Map1lc3b-positive puncta accumulation in the optic tectum of 3-dpf larvae that underwent indicated treatment for 24 h over 60 min; mean ± s.e.m. shown; n ≥ 11 for each group. p > 0.05 (n.s.), two-tailed unpaired t test (GraphPad Prism) .
Figure 6. Nilotinib induces autophagosome formation and increases autophagic flux. (a) Representative maximum confocal projections of the optic tectum regions of 3-dpf larvae that underwent indicated treatment for 24 h. Scale bars: 10 μm. (b) Quantification of the numbers of eGFP-Map1lc3b-positive puncta in the optic tectum of 3-dpf larvae that underwent indicated treatment for 24 h; mean ± s.e.m. shown; n = 15 for each group. ****p < 0.0001, two-tailed unpaired t test (GraphPad Prism). (c) Quantification of rate of eGFP-Map1lc3b-positive puncta accumulation in the optic tectum of 3-dpf larvae that underwent indicated treatment for 24 h over 60 min; mean ± s.e.m. shown; n = 10 for each group. *p < 0.05, two-tailed unpaired t test (GraphPad Prism).