Figures & data
Figure 1. NDV elevates glucose uptake and glycolysis in infectious cells. (A) Glucose uptake was determined by flow cytometry with 2-NBDG at 6, 12, 18, and 24 hpi. (B) Histograms present a quantification of glucose uptake and rest via mean fluorescence intensity (MFI). (C) The lactate levels in the culture medium were determined by the lactate assay kit at 6, 12, 18, and 24 hpi. (D) Heatmap of energy related metabolites changed. (E) Levels of glycolytic intermediates. (F) Levels of TCA cycle intermediates. (G) A549 cells were infected with mock or NDV (MOI = 1) for 1 h under continuous agitation and rested for 18 h in medium containing different glucose concentrations (0, 2.5, 5.5, and 11.1 mM). Whole-cell extracts were prepared from mock-infected and NDV-infected cells at 18 hpi, NP was used as a maker for virus infection. (H) Quantification of NP:ACTB ratio. (I) Quantification of TCID50. Data are mean ± SEM, all data are from three independent experiments. * p < 0.05, ** p < 0.01, *** p < 0.001, # p > 0.05.
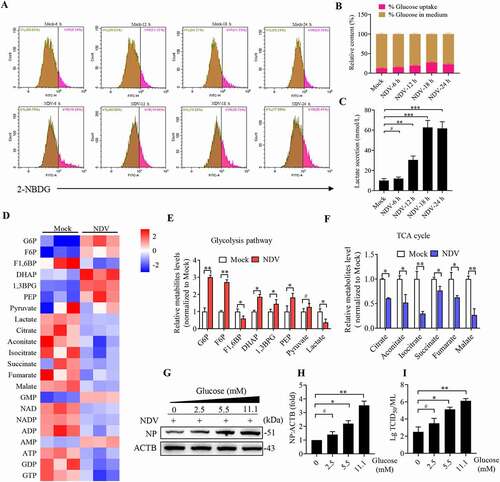
Figure 2. NDV infection induces mitochondria membrane depolarization, fission, and ETC dysfunction. (A and B) MMP were detected using flow cytometray by JC-1 stained, CCCP as a positive control. (C) Confocal microscopy images showing mitochondrial fragmentation at 6, 12, 18, and 24 hpi and CCCP group by MitoTracker stained. (D) Image-Pro Plus 6.0 software was used to calculate the ratio of cells that contain fragmented mitochondria in total cells. (E) MFN1, MFN2, OPA1, COX4I1, and ACTB protein levels were determined by western blot, NP was used as a maker for virus infection. (F-H) Quantification of MFN1, MFN2, and OPA1. (I) p-DNM1L (S616), p-DNM1L (S637), DNM1L and NP protein levels were determined by western blot at 18 hpi. (J and K) Quantification of p-DNM1L (Ser616):DNM1L ratio and p-DNM1L (Ser637):DNM1L ratio. (L) A549 cells were either mock or CCCP treated at 3 h and 6 h. MFN1, MFN2, COX4I1, and ACTB protein levels were determined by western blot. (M) Quantification of MFN1, MFN2, and COX4I1. (N) Mitochondria respiratory chain complex I activity was detected. A549 cells were prepared from mock-infected, NDV-infected cells at 18 hpi and treated with CCCP (10 μM). (O-Q) Real-time oxygen consumption rate (OCR) in mock-infected and NDV-infected cells was measured at 6, 12, 18, and 24 hpi. Statistical analysis of basal respiration and ATP production are shown on Figure P and Figure Q. White boxed regions in the panels are enlarged. Scale bar: 10 μm. Data are mean ± SEM, all data are from three independent experiments, * p < 0.05, ** p < 0.01, *** p < 0.001, # p > 0.05.
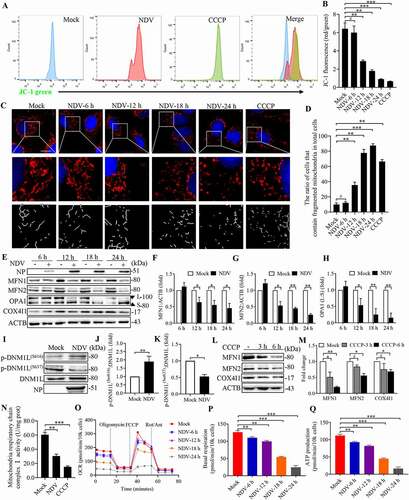
Figure 3. NDV reduces total ATP production, with a higher proportion of glycolysis-derived ATP. (A-C) Seahorse XF Real-time ATP rate analysis in A549 cells upon NDV infection at 6, 12, 18, and 24 hpi. Metabolic flux analysis on the Seahorse XF shows decrease in total ATP production in A549 cells compared to mock infection (A), with an increase proportion of ATP derived from glycolysis, decrease proportion of ATP derived from OXPHOS (B). Energetic map of the mitochondrial ATP production rate (mito-ATP) versus glycolysis ATP production rate (Glyco-ATP) (C). (D-F) Seahorse XF Real-time ATP rate analysis in DF-1 cells upon NDV infection at 6, 12, 18, and 24 hpi. Metabolic flux analysis on the Seahorse XF shows decrease in total ATP production in DF-1 cells at 6, 12, 18 and 24 hpi compared to mock infection (D), with an increase proportion of ATP derived from glycolysis, decrease proportion of ATP derived from OXPHOS (E). Energetic map of the mitochondrial ATP production rate (mito-ATP) versus glycolysis ATP production rate (Glyco-ATP) (F). (G-I) Seahorse XF Real-time ATP rate analysis in Hep G2 cells upon NDV infection at 6, 12, 18, and 24 hpi. Metabolic flux analysis on the Seahorse XF shows decrease in total ATP production in Hep G2 cells at 6, 12, 18, and 24 hpi compared to mock infection (G), with an increase proportion of ATP derived from glycolysis, decrease proportion of ATP derived from OXPHOS (H). Energetic map of the mitochondrial ATP production rate (mito-ATP) versus glycolysis ATP production rate (Glyco-ATP) (I). Data are mean ± SEM, all data are from three independent experiments.
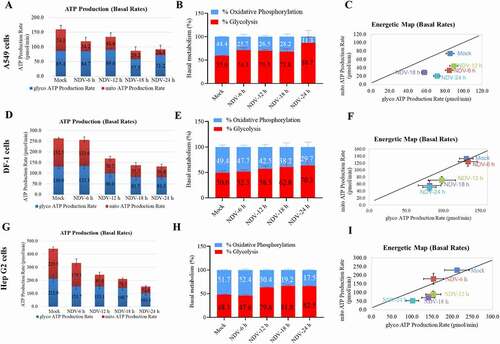
Figure 4. NDV infection shifts cellular metabolism toward glycolysis by stabilizing HIF1A, which facilitates NDV replication. (A) Cells were either mock treated or infected by NDV Herts/33 strain at an MOI of 1, whole-cell extracts were prepared from mock-infected and NDV-infected cells at 6, 12, 18, and 24 hpi. HIF1A-OH, HIF1A, and ACTB protein levels were determined by western blot, NP was used as a maker for virus infection. (B) Quantification of HIF1A. (C and D) A549 cells were mock treated or infected with NDV (MOI of 1) or cells were treated with ROS inhibitor (NAC) for final 3 h, and treated with ROT for 12 h as a positive control. mROS staining of A549 cells and quantification. (E and F) ECAR in mock-infected and NDV-infected cells was measured 6, 12, 18, and 24 hpi. (G) Cells were either mock treated or infected by NDV Herts/33 strain at an MOI of 1. mRNA levels were detected using qRT-PCR with HIF1A target genes. (H and I) Cells were mock treated or infected with NDV or Cells were treated with NAC for final 3 h, HIF1A and ACTB protein levels were determined by western blot and quantification of HIF1A. (J and K) HIF1A WT or HIF1A −/− of HeLa cells were infected at MOI = 1. HIF1A, NP, and ACTB protein levels were determined via western blot and quantification of HIF1A. (L) HIF1A WT or HIF1A −/− of HeLa cells were infected at MOI = 1. The lactate levels in the culture supernatants were determined by the lactate assay kit. (M) Schematic of glucose metabolism with metabolic modulators (PFKFB3 inhibitor PFK15, glycolysis inhibitor 2-DG, mitochondrial respiration complex I inhibitor rotenone and ATP synthase inhibitor oligomycin). (N) A549 cells were infected with mock or NDV-GFP (MOI 1) for 1 h under continuous agitation and rested for 18 h in media containing different inhibitors (PFKFB3 inhibitor PFK15, glycolysis inhibitor 2-DG, mitochondria respiratory chain complex I inhibitor rotenone and ATP synthase inhibitor oligomycin. GFP positive were infected cells based on microscopy. (O) NDV-GFP were detected using flow cytometry. (P) Quantification of NDV-GFP ration following either mock treated or infected at in media containing different inhibitors. Data are mean ± SEM, all data are from three independent experiments, * p < 0.05, ** p < 0.01, # p > 0.05.
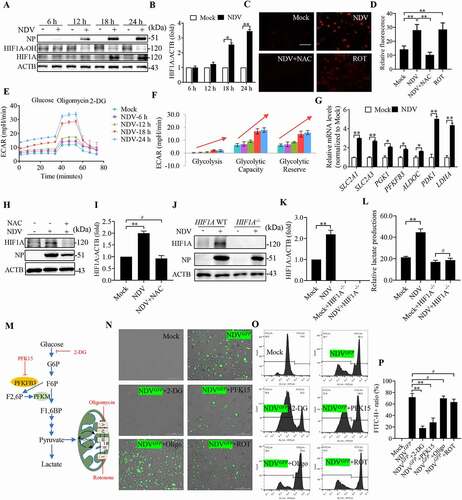
Figure 5. NDV reduces mitochondrial SIRT3, regulates HIF1A stability, and promotes the Warburg effect. (A) A network model describing interactions between the HIF1A and SIRT3-targeted metabolic genes. (B) SIRT3 expression levels and several HIF1A target genes were determined using the Oncomine cancer microarray database (http://www.oncomine.org) in normal breast samples versus breast cancer samples. (C) RNA-seq data showing enrichment of HIF1A, SIRT3, and glycolysis pathways in NDV-infected cells. (D and E) A549 cells were transfected with SIRT3 siRNA or siNC. SIRT3, HIF1A, HK2, PFKFB3, LDHA, and ACTB protein levels were determined via western blot and quantification. (F-H) A549 cells were transfected with SIRT3 siRNA or siNC. Glucose uptake (F), lactate levels in the culture supernatants (G) and mROS (H) were determined. (I and J) A549 Cells were either mock treated or infected by NDV Herts/33 strain at an MOI of 1, whole-cell extracts were prepared from mock-infected and NDV-infected cells at 6, 12, 18, and 24 hpi. SIRT3, NP, and ACTB protein levels were determined by western blot and quantification of SIRT3, NP was used as a maker for virus infection. (K and L) A549 cells were either mock treated or infected with NDV Herts/33 strain at an MOI of 0.01, 0.1, 1, and 5 or with UV-treated NDV Herts/33 strain. NP, SIRT3, and ACTB protein levels were determined via western blot and quantification of SIRT3. (M and N) A549 cells were either mock treated or infected with different NDV strains (Herts/33, Lasota, and ZJ-1). NP, SIRT3, and ACTB protein levels were determined via western blot and quantification of SIRT3. Data are mean ± SEM, all data are from three independent experiments, * p < 0.05, ** p < 0.01, # p > 0.05.
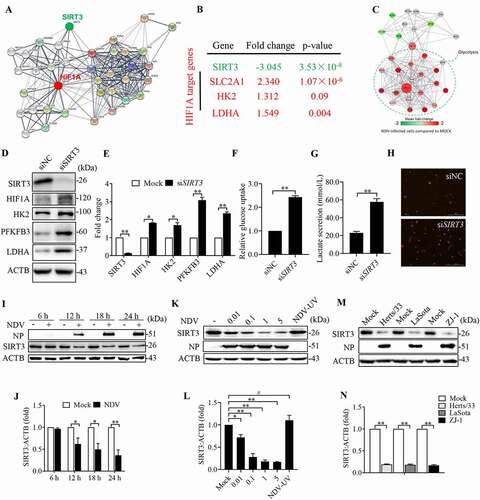
Figure 6. AMPK-MTOR axis regulated autophagy contributes to the degradation of SIRT3 during NDV infection. (A and B) A549 cells were either mock treated or infected with NDV Herts/33 strain at an MOI of 1. Electron microscopy images revealed the mitochondrial ultrastructure. In the zoomed images, typical elongated tubular mitochondria in mock cells and fragmented elliptic mitochondria engulfed with membrane-like vesicles in NDV- infected cells were observed. (C) Quantification of the mitophagosome-like vesicles per cell. Scale bar: 2 μm. (D) Adenylates AMP, ADP, and ATP were determined via HPLC following either mock treatment or NDV infection at 18 h. (E) AMP:ATP ratios in mock versus NDV-infected A549 cells. (F) p-PRKAA, PRKAA, p-MTOR, MTOR, LC3, SQSTM1, and ACTB protein levels were determined via western blot. (G-J) Quantification of p-PRKAA:PRKAA ratio, p-MTOR:MTOR ratio and quantification of SQSTM1, LC3-II:I ratio. (K) Western blot showing p-PRKAA, PRKAA, LC3 and SQSTM1 expression in NDV-infected cells (18 hpi) treated with AMPK inhibitors, CC. (L and M) A549 cells were either mock treated or infected with NDV Herts/33 strain at an MOI of 1. Western blot showing SIRT3 expression in NDV-infected cells (18 hpi) treated with autophagy inhibitors: CQ for the final 6 h. CQ was added at 1, 10, and 50 μM after NDV infection at an MOI of 1. Mock samples were treated in the presence or absence of CQ (50 μM) and quantification of SIRT3. (N and O) Treated with protease inhibitor MG132 for the final 6 h. MG132 was added at 1, 5, and 10 μM after NDV infection at an MOI of mock samples were treated in the presence or absence of MG132 (10 μM) and quantification of SIRT3. (P) Immunofluorescence of mock, NDV, and NDV+CQ (50 μM for the final 6 h) infected A549 cells stained for NP, SIRT3, and LysoTracker. (Q) Quantification of SIRT3 fluorescence intensity. White boxed regions in the panels are enlarged. Scale bar: 10 μm, Data are mean ± SEM, all data are from three independent experiments, ** p < 0.01, *** p < 0.001, # p > 0.05.
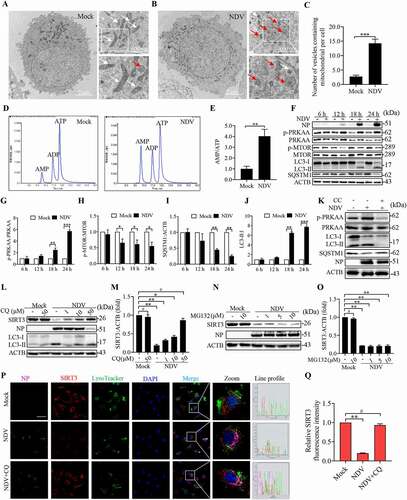
Figure 7. NDV induces SIRT3 degradation via PINK1-PRKN-dependent selective mitophagy. (A) Diagram of tandem-tagged mCherry-GFP-FIS1 based mitophagy assay. (B) HeLa cells expressing the mCherry-GFP-FIS based mitophagy assay reporter were treated with NDV for 18 h or CCCP for 6 h. Cells were fixed and subjected to immunofluorescence analysis to detect mitochondrial fluorescence (red and green). (C) Quantification of GFP fluorescence intensity. (D) A549 cells were treated with NDV for 18 h or CCCP for 6 h. PINK1 and ACTB protein levels were determined via western blot. (E) Quantification of PINK1:ACTB ratio. (F) Cytoplasm and mitochondria were separated and purified. After purification, COX4I1, PINK1, and GAPDH protein levels were determined via western blot. (G) A549 cells were mock treated or infected with NDV (MOI = 1) or treated with CCCP for the final 6 h and added in the presence or absence of the mitophagy inhibitor, mdivi-1. NP, PINK1, SIRT3, and ACTB protein levels were determined via western blot and quantification of SIRT3. (I and J) A549 cells were transfected with PINK1 siRNA or siNC. NP, PINK1, SIRT3, and ACTB protein levels were determined via western blot and quantification of SIRT3. (K and L) PINK1 WT or PINK1−/− of HeLa cells were infected at MOI = 1 or treated with mock infection. NP, PINK1, SIRT3, and ACTB protein levels were determined via western blot and quantification of SIRT3. Data are mean ± SEM, all data are from three independent experiments, * p < 0.05, ** p < 0.01, # p > 0.05.
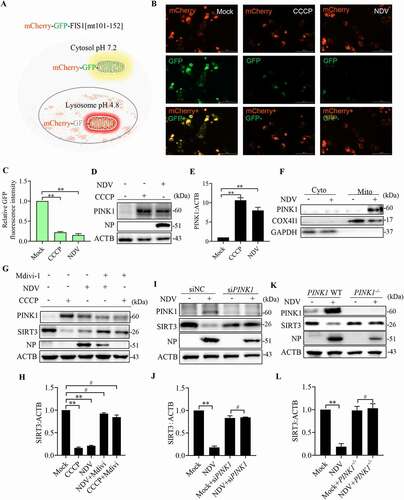
Figure 8. SIRT3 degradation promotes glycolysis to support virus replication. (A) siSIRT3 or siNC of A549 cells were infected at MOI = 1 or treated with mock infection. SIRT3, NP, and ACTB protein levels were determined via western blot. (B-D) siSIRT3 or siNC of A549 cells were infected at MOI = 1 or treated with mock infection. Glucose uptake (B), lactate levels in the culture supernatants (C) and viral titers (D) were determined. (E and F) PINK1 WT or PINK1−/− of HeLa cells were infected at MOI = 1 or treated with mock infection. The lactate levels in the culture medium (E) and glucose uptake (F) were determined. (G) PINK1 WT or PINK1−/− of HeLa cells were infected or treated with mock infection. mRNA levels were detected using qRT-PCR with HIF1A target genes. (H) PINK1 WT or PINK1−/− of HeLa cells were infected or treated with mock infection. Heatmap of altered energy-related metabolites. Data are mean ± SEM, all data are from three independent experiments, * p < 0.05, ** p < 0.01, *** p < 0.001.
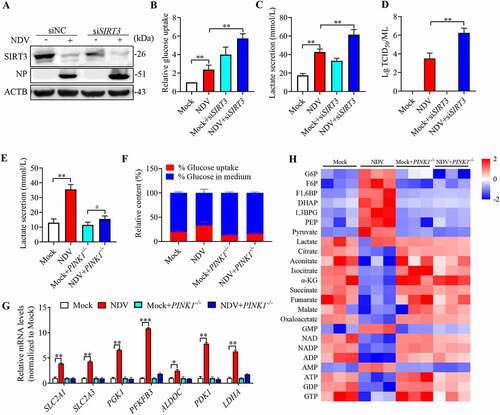
Figure 9. NDV induces SIRT3 degradation and reprogram energy metabolism in avian cells. (A, B, and E) DF-1 Cells were either mock treated or infected by NDV Herts/33 strain at an MOI of 1, whole-cell extracts were prepared from mock-infected and NDV-infected cells at 6, 12, 18, and 24 hpi. SIRT3 and ACTB protein levels were determined by western blot and quantification of SIRT3, NP was used as a maker for virus infection. The lactate levels of DF-1 in the culture medium were determined (E). (C, D, and F) CEF cells were either mock treated or infected by NDV Herts/33 strain at an MOI of 1, whole-cell extracts were prepared from mock-infected and NDV-infected cells at 6, 12, 18, and 24 hpi. SIRT3 and ACTB protein levels were determined by western blot and quantification of SIRT3, NP was used as a maker for virus infection. The lactate levels of CEF in the culture medium were determined (F). (G) Heatmap of energy related metabolites. (H) Schematic of glucose metabolism, red arrow show intermediates were up-regulated and blue arrow show intermediates were down-regulated. Data are mean ± SEM, all data are from three independent experiments, * p < 0.05, ** p < 0.01, *** p < 0.001.
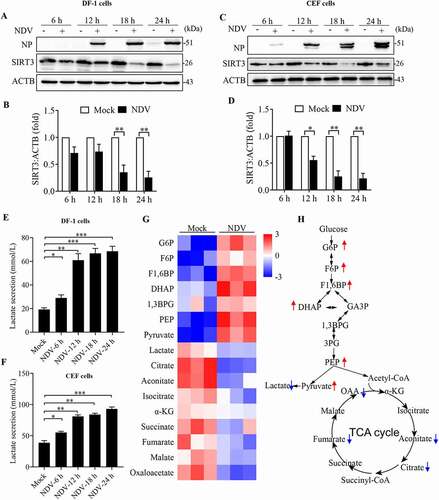
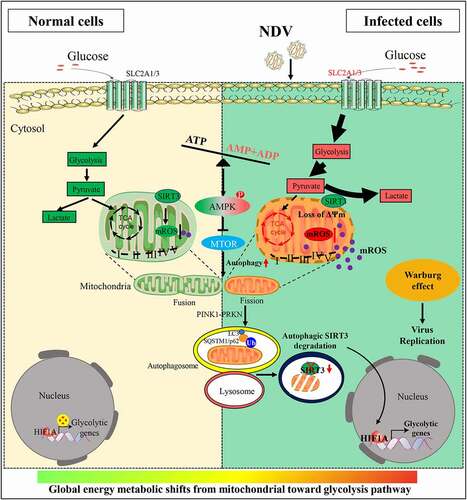
Figure 10. Diagram depicting NDV-driven energy metabolic reprogramming to facilitates virus replication. NDV promotes glucose utilization and aerobic glycolysis in infectious cells, Upregulating glycolysis (the Warburg effect) can compensate for the lack of ATP production by the OXPHOS. In brief, NDV infection is harmful not only for mitochondria but also promotes mitochondria from fusion to fission and energy stress (imbalance in ATP, ADP and AMP levels). Damaged mitochondria were degraded by selective autophagy, SIRT3 was degraded by PINK1-PRKN-dependent selective mitophagy. Consequently, degradation of SIRT3 in damaged mitochondria, increases cellular mROS levels, leading to increased HIF1A stabilization and its target genes expression in NDV infectious cells, shifts mitochondrial bioenergetic metabolism toward aerobic glycolysis.