Figures & data
Figure 1. Multiparameter assays for TFEB and TFE3 translocation and lysosome activity. (A) Endogenous TFEB stained by immunocytochemistry can be seen to translocate at high levels to the nucleus upon treatment with chloroquine (CQ; 20 µM). The ratio of fluorescent signal in the cytoplasm:nucleus regions determines the percentage of cells which show nuclear translocation (nTFEB/nTFE3). Scale bars: 50 µm. (B) TFEB translocation in response to CQ is concentration-dependent and (C) can be robustly quantified across a plate in 384-well format. (D, E, F) Endogenous TFE3 stained by immunocytochemistry can be quantified in a similar manner to previously described for TFEB and shows the same pattern of translocation with CQ. Scale bars: 50 µm. (G) SH-SY5Y treated with DQ Red BSA reagent develop yellow fluorescent puncta under vehicle-only culture conditions, the signal of which is increased upon treatment with the HDAC inhibitor CI-994 (10 µM) and reduced by lysosomal inhibition with CQ (20 µM). The puncta are segmented and quantified to give spot count and fluorescent intensity. Scale bars: 20 µm. (H) CI-994 increases and CQ reduces lysosome count of DQ Red BSA puncta in a concentration-dependent manner. (I) The alterations in lysosome count can be robustly quantified across a 384-well plate. Images show CI-994 at 10 µM and CQ at 20 µM. n = 1. Values represent mean technical replicates ± s.d.
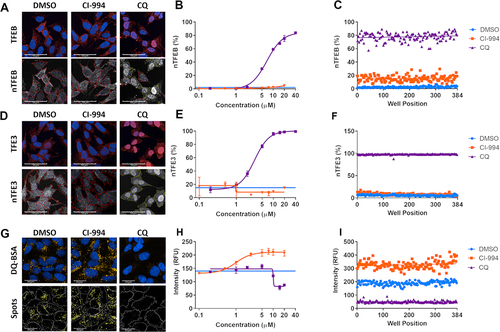
Figure 2. Screening the PKIS2 library. (A) The 490 PKIS2 compounds were screened at 1 µM across all assays and passed through an analysis cascade to identify nontoxic compounds which translocate TFEB and/or TFE3. (B) AK release and (C) nuclear count from immunocytochemistry images are used to assess cellular toxicity, indicated by those compounds (in red) which fall outside the 2 s.d. range of the vehicle controls (indicated by the red line). (D) Active lysosome count and (E) corrected fluorescence intensity as measured from the DQ Red BSA assay are used to assess lysosomal toxicity, indicated by those compounds (in Orange) which fall below the 2 s.d. range of the vehicle controls (indicated by the Orange line). Any which fall above the 2 s.d. range of the assay are classified as positive hits for DQ Red BSA. Remaining compounds with no associated toxicity which show nuclear translocation above the 3 s.d. range of the vehicle-only control for (F) nuclear TFEB (% nTFEB) and/or (G) nuclear TFE3 (% nTFE3) translocation are classified as positive hits. A total of 74 positive hits were identified. n = 1.
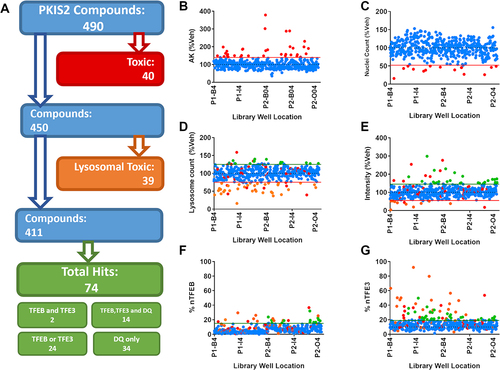
Figure 3. Patterns of activity enriched within identified chemotypes. (A) Chemotypes showing enrichment >2 against a particular biological output. The “2-aryl-4-anilino(pyridine-4-yl)-quinazoline and analogs” chemotype (blue) is enriched for TFEB and TFE3 translocation hits, “4-anilinoquinoline” chemotype (red) is enriched for lysosomal toxicity and the “4-aryl-azaindole” chemotype (purple) is enriched for both TFEB and TFE3 translocation and increased lysosome activity. (B) Correlation between %nTFE3 translocation and lysosome function is often associated with reduced lysosome function indicated by reduced lysosome count, particularly noticeable in the “4-anilinoquinoline” chemotype (red). (C-E) % nTF indicates the nuclear TFEB and TFE3 translocation, (F-H) DQ Red BSA degradation and (I-K) AK and nuclear count for toxicity were measured after SH-SY5Y cells were exposed to increasing concentrations of compound for 24 h (n = 1 due to compound availability; error bars = s.d.). (C, F, I) The compound UNC10225484A of the “4-anilinoquinoline chemotype” shows a modest TFEB and 3 translocation at 2 µM but a correlated drop in DQ Red BSA spot count with no indication of cellular toxicity. (D, G, J) The compound UNC10225412A of the “4-aryl-azaindole” chemotype shows strong TFE3 translocation and an increase in DQ Red BSA intensity with no toxicity. (E, H, K) The compound UNC10225477A of the “2-aryl-4-anilino(pyridine-4-yl)-quinazoline and analogs” chemotype shows modest TFEB and TFE3 translocation with no increases in DQ Red BSA intensity or cellular toxicity. AK is reduced, suggesting either decreased cell death or off-target inhibition of AK enzyme. n = 1 for all above assays, mean ±s.d. *p < 0.05, **p < 0.01, *** p < 0.001, **** p < 0.0001 Two-way ANOVA with Dunnett’s multiple comparisons test.
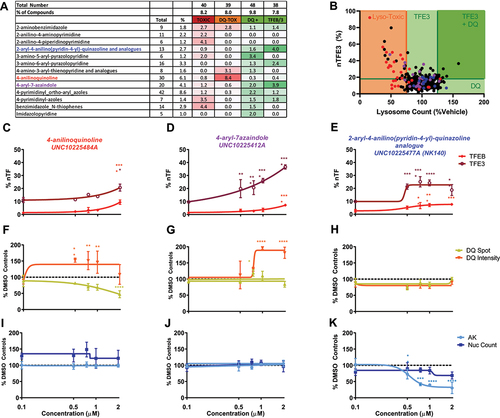
Figure 4. A novel chemical series which modulates TFEB and TFE3 regulation and lysosome activity. (A, B) a series of novel analogs of NK140 was assessed in concentration response at 24 h treatment time for toxicity and activity across the panel of assays. (C) TFEB and TFE3 translocation was confirmed to be induced by the hit compound NK140 but not the negative compound NK164. TFEB and TFE3 translocation is also induced by the analogs NK176 and NK177. DQ Red BSA signal was seen to be slightly, but not-significantly, increased. NK140, NK176 and NK177 show a small reduction in nuclear count from 0.75 µM without increases in AK, suggesting a small anti-proliferative effect over 48 h treatment. n = 3 for all above assays, mean ± s.d. *p < 0.05, **p < 0.01, *** p < 0.001, **** p < 0.0001 Two-way ANOVA with Dunnett’s multiple comparisons test. (D) iPSC-derived i3Neurons treated with compounds as shown were stained with DAPI (blue), and immunostained for MAP2 (yellow) and TFE3 (red). Scale bars: 50 µm. (E) Nuclear translocation of TFE3 was quantified, showing a significant relocalization by the active compound NK177 (n = 3 for all above assays, mean ± s.d.; One-way ANOVA with Dunnett’s multiple comparisons test).
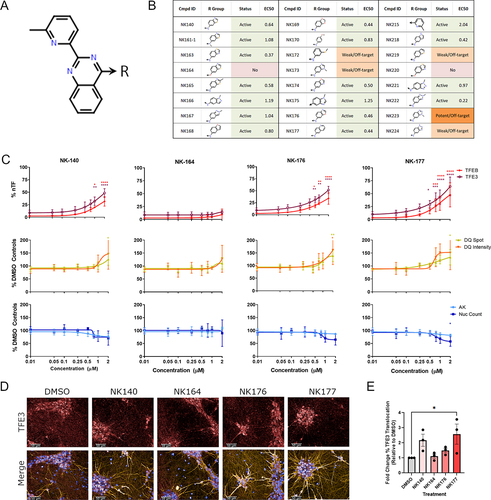
Figure 5. Quinazoline analog series activity is independent of PRKD. (A) The top results from the KiNativ in-cell kinase binding activity, highlight specific binding to PRKD2 and PRKD3. (B) Structures of commercially available protein kinase D inhibitors CID2011756 and CID755673. (C) %nTF indicates the percentage of nuclear TFEB and TFE3 translocation, DQ Red BSA degradation and AK and nuclear count for toxicity were measured in SH-SY5Y cells after exposure to increasing concentrations of CID2011756 and CID755673 compounds for 24 h. CID2011756 shows some TFEB and TFE3 translocation only at 20 µM where there is also some reduction of DQ Red BSA signal and toxicity. CID755673 shows no TFEB and TFE3 translocation, alteration in DQ Red BSA signal or toxicity. (D) Using CRISPRi, PRKD2 and PRKD3 were knocked down to ~21 and 25% of basal levels, respectively, as measured by western blotting. (E) sgRNA guides were co-expressed with iRFP670, allowing visualization of vector transduction alongside PRKD2 and PRKD3 knockdown using immunocytochemistry. Scale bars: 50 µm. (F) Guide fluorescence, nuclear count, DQ Red BSA active spot count and correct fluorescent intensity and TFEB and TFE3 translocation showed no differences between targeting guides and appropriate Scr controls. (G) Cells treated with Scr or PRKD2 or PRKD3 targeting guides were exposed to increasing concentrations of NK140 compound; however, demonstrated no increased activity in the TFE3 translocation assay (n = 3 biological replicates, error bars = s.d). n = 3 for all above assays, mean ± s.d. *p < 0.05, **p < 0.01, *** p < 0.001, **** p < 0.0001 One-way ANOVA with Dunnett’s multiple comparisons test.
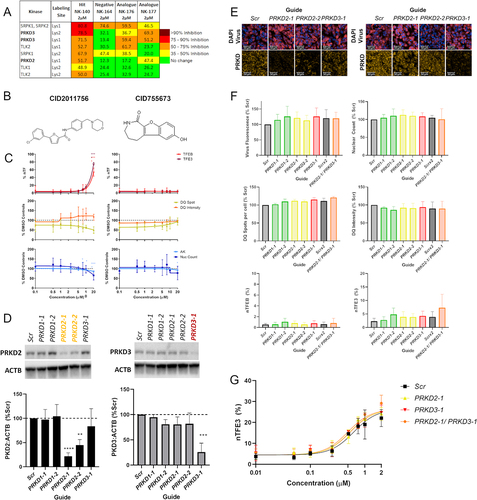
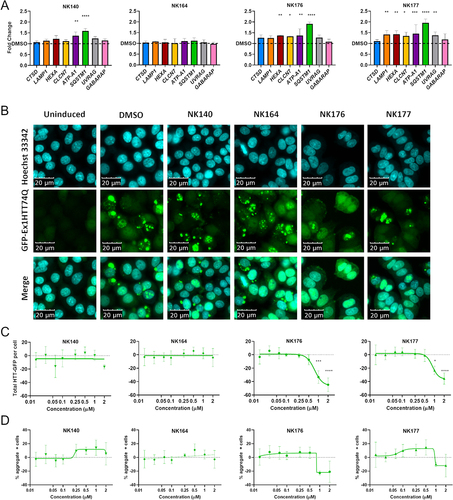
Figure 6. Upregulation of CLEAR genes and clearance of HTT aggregates. (A) Expression of eight CLEAR genes, CSTD, LAMP1, HEXA, CLCN7, ATP6V0A1 (ATP-A1), SQSTM1, UVRAG and GABARAP was assessed after treatment with 1 µM compound for 48 h and showed significant increase of multiple genes with NK176 and NK177 treatment. (B) GFP-Ex1HTT74Q HTT expression can be induced, and visualized as bright puncta where aggregates are formed. Nuclei stained with Hoechst 33,342. (C) Total-GFP fluorescence shows reduction in signal after treatment with either NK176 or NK177 at 1 and 2 µM (n = 3). (D) The percentage of cells bearing aggregates is reduced at higher concentrations, but the difference is non-significant due to the variability in the assay output. n = 3 except for NK176 and NK177 1 and 2 µM where n = 2. * p < 0.05, *** p < 0.0, **** p < 0.0001 Two-Way ANOVA with Dunnett’s multiple comparisons test.