Figures & data
Figure 1. Methylation profiles of LNCaP, 22Rv1 and PC-3 cell lines before and after radiotherapy. Prostate cancer cell lines were exposed to 2 Gy radiation and DNA was extracted at 0, 1 and 14 d. DNA methylation was profiled using the Illumina Infinium HM450K platform. (a) Density distribution of β values for the LNCaP, 22Rv1 and PC-3 cell lines. (b) β value distribution for the three cell lines and time-points. (c) Sample relatedness ranked according to methylation status across the cell lines and time-points.
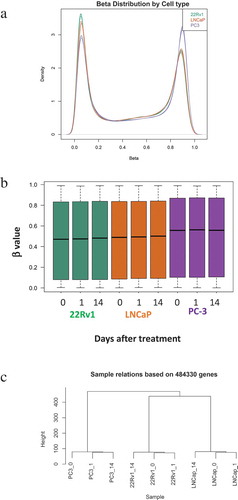
Figure 2. Methylation changes following radiotherapy in LNCaP, 22Rv1 and PC-3 cells. Prostate cancer cell lines were exposed to 2 Gy radiation and DNA was extracted at 0, 1 and 14 d. DNA methylation was profiled using the Illumina Infinium HM450K platform. (a) Heatmaps (generated using Morpheus https://software.broadinstitute.org/morpheus/) based on β values of differentially methylated regions post-radiotherapy in LNCaP, 22Rv1 and PC-3 prostate cancer cells at 0, 1 and 14 d. β values range from 0 to 1 with 0 being unmethylated (blue) and 1 being 100% methylated (red). (b) Bisulphite sequencing validation of methylation for the HOXA11 gene body for six clones (Illumina probe cg27309564 spans last three CpGs highlighted in box) in 22Rv1 cells. White circles represent unmethylated CpGs and black circles represent methylated CpGs.
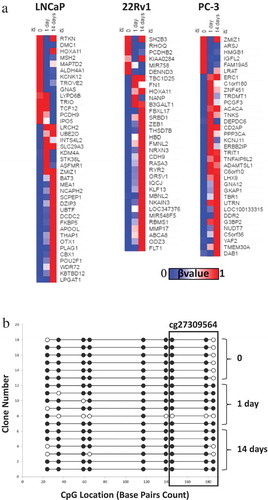
Figure 3. Basal susceptibility to DNA damage and DNA damage recovery in sensitive and resistant prostate cancer cell lines. PC-3 and LNCaP cells were grown on chamber slides and exposed to phleomycin for 1 h and left to recover for the indicated times. Cells were then probed for γH2A.X foci via immunofluorescence staining and the average number of foci for 100 cells determined. (a) Basal levels of DNA damage in LNCaP cells and PC-3 cells. (b) Foci counts for PC-3 cells following phleomycin recovery. (c) Foci counts for LNCaP cells following phleomycin recovery. The experiments were performed in triplicate and the average number of foci for 100 cells determined. The mean and SEM for three biological replicates are shown. Statistical significance was determined using Student’s t Test (a) or One-way ANOVA (b & c) *P < 0.05.
Figure 4. Influence of 5-AzaC on cell survival and DNA repair. PC-3 cells were either pre-treated with 5-AzaC or left untreated, then treated with phleomycin for 1 h and left to recover. (a) Clonogenic assay showing cell survival with or without 5-AzaC pre-treatment. The mean and SEM for three biological replicates are shown. (b) Average foci counts for γH2A.X staining. The mean and SEM for three biological replicates are shown. Statistical significance was determined using Two-way ANOVA, *P < 0.01. (c) Representative example for immunofluorescence staining of DNMT1 and γH2A.X in cells treated with or without 5-AzaC prior to phleomycin addition.
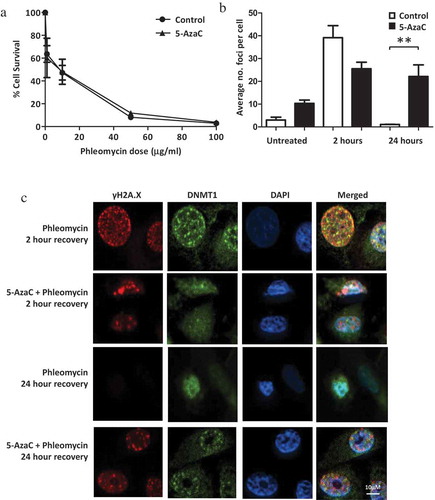
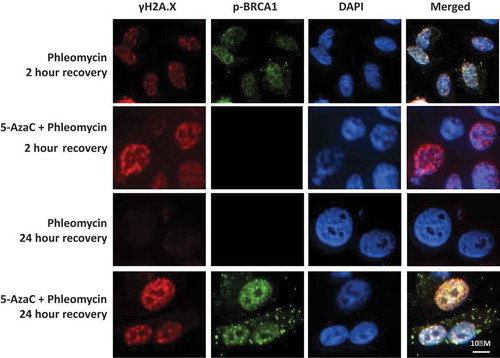
Figure 5. Influence of 5-AzaC on BRCA1 recruitment and DNA repair. PC-3 cells were grown on chamber slides, either pre-treated with 5-azacytidine or left untreated, then treated with phleomycin for 1 h and left to recover for 2 or 24 h. Cells were then fixed and probed for p-BRCA1 (ser1423) and γH2A.X via immunofluorescence staining.