
Figures & data
Figure 1. Life history stages are from [Citation56]. Infancy is defined as birth until weaning, juvenility from weaning until menarche, adolescence from menarche until the onset of reproduction. Age at which 95% of adult brain size is attained from [Citation57]. Age at peak reproduction is the peak proportion of females reproducing at this age and is from [Citation58]. Chimpanzee estimate of age at first reproduction (AFR) is from wild populations and maximum lifespan (ML) estimates from captivity [Citation44]. Human estimate of AFR based on compiled data from four contemporary hunter-gatherer groups (the Ache, Hadza, Hiwi, and!Kung) reported in [Citation44]. Human ML (122) is also given in [Citation44]. *Age at last reproduction is from [Citation59]. The estimate of 39 for humans comes from the average age at last reproduction across three forager populations. Because most female chimpanzees die before reproductive senescence, these numbers are likely not equivalent for chimpanzees. [Citation57], give an age at last birth of 42 for chimpanzees based on an average of maximum ages of last birth in four wild chimpanzee populations and 45 for humans, but which is based again on average age at last birth, not maximum. B.Brain regions analysed and dendrograms of hierarchical clustering based on full methylation data. Samples ending in ‘a’ are DLPFC samples and ending in ‘d’ are cerebellum samples. Sample numbers 1–8 are chimpanzee samples and sample numbers 19–24 and 26 are human samples. Chimpanzee and human brain figures taken from [Citation60].
![Figure 1. Life history stages are from [Citation56]. Infancy is defined as birth until weaning, juvenility from weaning until menarche, adolescence from menarche until the onset of reproduction. Age at which 95% of adult brain size is attained from [Citation57]. Age at peak reproduction is the peak proportion of females reproducing at this age and is from [Citation58]. Chimpanzee estimate of age at first reproduction (AFR) is from wild populations and maximum lifespan (ML) estimates from captivity [Citation44]. Human estimate of AFR based on compiled data from four contemporary hunter-gatherer groups (the Ache, Hadza, Hiwi, and!Kung) reported in [Citation44]. Human ML (122) is also given in [Citation44]. *Age at last reproduction is from [Citation59]. The estimate of 39 for humans comes from the average age at last reproduction across three forager populations. Because most female chimpanzees die before reproductive senescence, these numbers are likely not equivalent for chimpanzees. [Citation57], give an age at last birth of 42 for chimpanzees based on an average of maximum ages of last birth in four wild chimpanzee populations and 45 for humans, but which is based again on average age at last birth, not maximum. B.Brain regions analysed and dendrograms of hierarchical clustering based on full methylation data. Samples ending in ‘a’ are DLPFC samples and ending in ‘d’ are cerebellum samples. Sample numbers 1–8 are chimpanzee samples and sample numbers 19–24 and 26 are human samples. Chimpanzee and human brain figures taken from [Citation60].](/cms/asset/ab918749-340a-4763-89d6-c3ee1458c3c9/kepi_a_2080993_f0001_oc.jpg)
Table 1. Study subjects.
Figure 2. Epigenetic age estimates using the Horvath clock for humans and chimpanzees and results of the ANCOVA. A & B: Spearman’s rho is shown for each species (A = humans, B = chimpanzees) and region. C & D: Results of the ANCOVA comparing slopes of ageing for each region for (c) humans and (d) chimpanzees, along with the regression equations for each line. CB = cerebellum, DLPFC = dorsolateral prefrontal cortex.
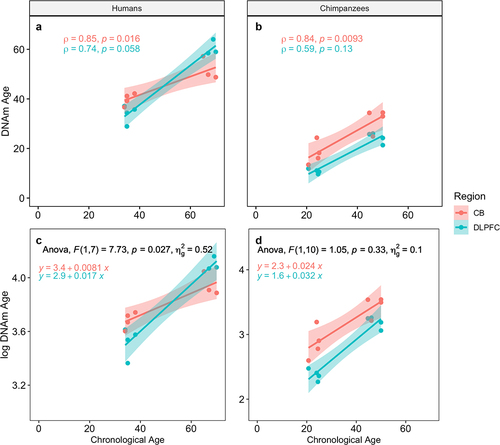
Table 2. Results of the covariance analysis.
Data availability statement
Metadata, raw spectral intensity data, and normalized beta value data are available in NCBI’s Gene Expression Omnibus (https://www.ncbi.nlm.nih.gov/sra) under accession GSE154403. R code used for all analyses is available on www.chimpanzeebrain.org.