
Figures & data
Table 1. The status of ITP patients at recruitment and tests underwent.
Figure 1. Flow cytometry analysis of ITP and control peripheral lymphocytes. (a,b) The percentage and absolute count of B cells in ITP patients were significantly increased compared with that in control (P = 0.021 and 0.032, respectively, bars at median with interquartile range). (c) CD72 expression in B cells was significantly different between npITP, ITPr, and control with median of 87.35%, 78.19%, and 83.72%, respectively (P = 0.049, bars at median with interquartile range). (d) The percentage of CD72-positive B cells of npITP was significantly higher than that of ITPr (P = 0.018, bars at median with interquartile range). (e) There is no significant difference in CD72-positive B cell percentages between npITP and control (P = 0.18, bars at median with interquartile range).
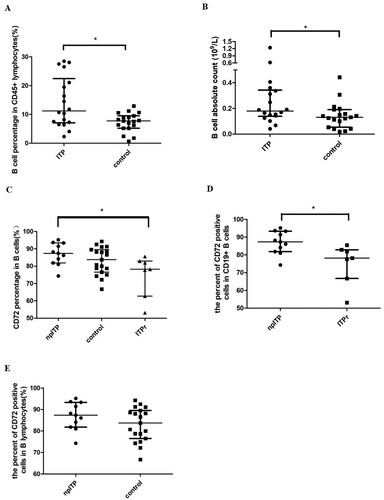
Figure 2. The effect of anti-CD72 on B cell proliferation during in vitro culture of ITP patients’ mononuclear cells. (a) Histograms represent CD72 antibody cultured cells (red line) or isotype antibody cultured cells (green-filled histogram). (b) Anti-CD72 significantly decreased B cell proliferation of ITP patients in vitro (**P = 0.009). (c) Anti-CD72 decreased B cell proliferation from control in culture (*P = 0.021).
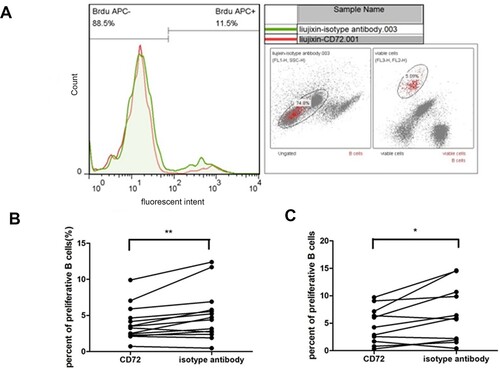
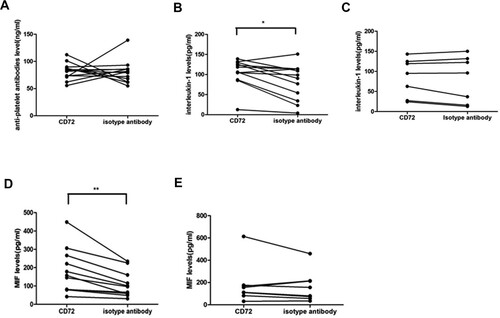
Figure 3. The effect of anti-CD72 on the levels of platelet antibody, interleukin 1(IL-1), and macrophage migration inhibitory factor (MIF) during in vitro culture. (a) Platelet antibody levels were not significantly different between CD72 and isotype antibody-added cultures in ITP. B. IL-1 was significantly elevated by the addition of CD72 antibody in the group of ITP (*P = 0.014). (c) IL-1 levels were not significantly different between CD72 and isotype antibody-added cultures in control group. (d) MIF was significantly increased in CD72 added culture compared with isotype antibody in ITP group (**P = 0.002). (e) MIF was not obviously different between CD72 and isotype antibody-added cultures in control group.
Data availability statement
All data generated or used during the study appeared in the submitted article.