Figures & data
Figure 1. Inflorescences (A) and leaves (B) of B. carinata.
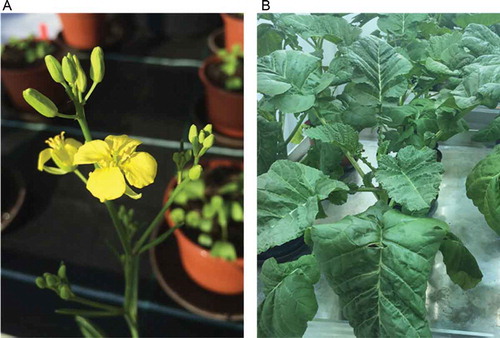
Figure 2. Anti-genotoxic potential of ethanolic extracts of raw and processed B. carinata. DNA damage in AFB1-treated cells is shown as percent of control. Data are means ± SEM of three independent experiments. Asterisks indicate statistically significant differences between the respective treatment and the positive control (= without B. carinata extract). SC = solvent control (0.1% DMSO).
Figure 3. Anti-oxidative potential of ethanolic extracts of raw and processed B. carinata. A and B) ROS production as determined by the EPR method in response to 200 µM menadione in cells pre-treated with B. carinata extracts. C) and D) Induction of ARE/Nrf-2-mediated gene expression in cells treated with B. carinata extracts. Data are means ± SEM of three independent experiments expressed as percent of control. Asterisks indicate statistically significant differences between the respective treatment and the positive control (= without B. carinata extract; A, B) or the SC (C, D). SC = solvent control (0.7% EtOH).
Figure 4. Cytotoxic (A,B) and cytostatic (C, D) potential of ethanolic extracts of raw and processed B. carinata. Data are means ± SEM of three independent experiments. Asterisks indicate statistically significant differences between the respective treatment and SC. SC = solvent control (0.7% EtOH).
Figure 5. Total content of secondary plant metabolites in ethanolic extracts of raw, fermented, and cooked B. carinata. Results are presented in µg/mL on a logarithmic scale. The first raw and fermented extracts are from location A, while the second raw and cooked extracts are from location B.