Table 1. F statistic and significant p-value summary table for all main and interactive effects, operating on all floristic and physical structure parameters.
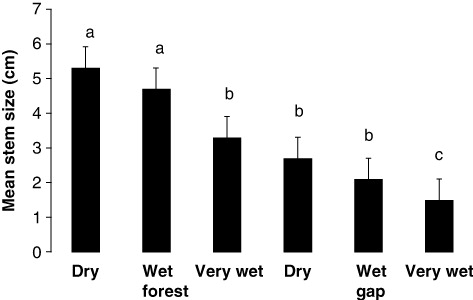
Figure 1. Means and standard errors of mean stem size in all plots grouped by the significant interaction effect between forest type × openness. Means testing results are indicated by lowercase letters. If groups were different then the letters are different.
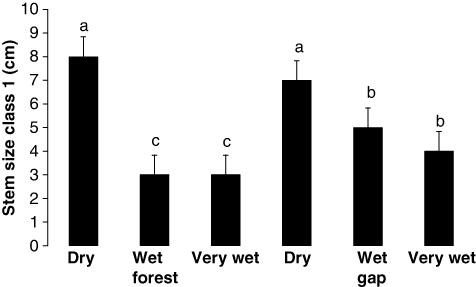
Figure 2. Means and standard errors of no. of stems in size class 1 in all plots grouped by the significant interaction effect between forest type × openness. Means testing results are indicated by lowercase letters. If groups were different then the letters are different.
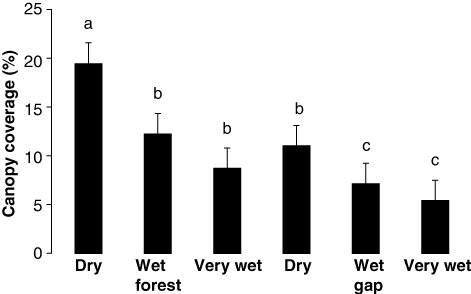
Figure 3. Means and standard errors of % canopy closure in all plots grouped by the significant interaction effect between forest type × openness. Means testing results are indicated by lowercase letters. If groups were different then the letters are different.