1,012
Views
6
CrossRef citations to date
0
Altmetric
Plant-Environment Interactions

Developmental- and stress-mediated expression analysis of cinnamoyl-CoA reductase 1 (CCR1) from Hibiscus cannabinus

, , , , &
Pages 158-166 | Received 17 Mar 2015, Accepted 09 May 2015, Published online: 26 Jun 2015

Figures & data

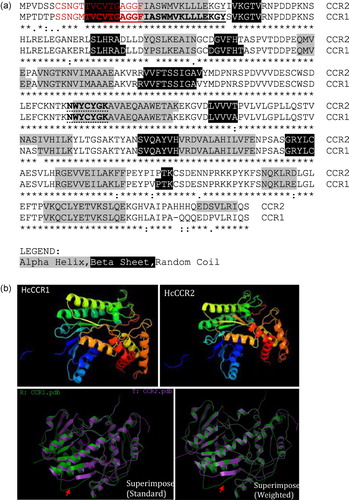
Figure 1. (a) Global alignment and predicted secondary structure of two kenaf homologs. NAD(P)-binding domain at the N-terminal and catalytic domain (NWYCYGK) are underlined with solid and dashed lines, respectively. Amino acids in red show predicted palmitoylation sites. (b) Predicted tertiary structure of HcCCR1 and HcCCR2 protein and their superimposition. Structural differences are indicated by the red arrow. Tertiary structure of HcCCR1 and HcCCR2 was predicted using the Phyre2server. Superimposition of the two structures was conducted using BioSuper.
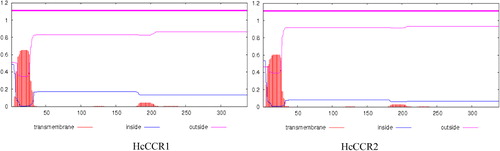
Figure 2. Transmembrane domain prediction of HcCCR1 and HcCCR2. HcCCR1 and HcCCR2 do not contain any transmembrane helices and are therefore assumed to be localized in cytosol. The vertical axis and horizontal axis represents posterior probability and amino acid number, respectively.
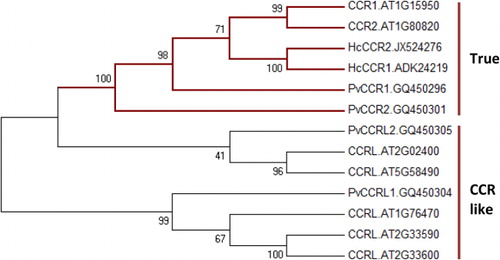
Figure 3. Phylogenetic analysis of the deduced amino acid sequences of kenaf CCR orthologs, including Arabidopsis and switch grass true and CCR-like protein sequences. The tree was constructed by the neighbor-joining method of ClustalW and MEGA5. The numbers at the nodes indicate bootstrap values from 1000 replications.
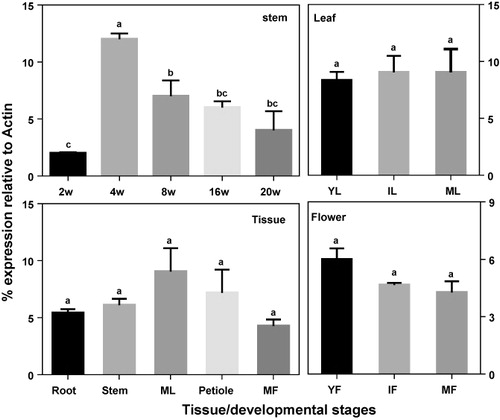
Figure 4. Transcript expression patterns of HcCCR1 in various tissues and organs during developmental stages. Relative transcript levels were measured using qRT-PCR with ACTIN as the internal control. The transcript levels of the kenaf CCR ortholog were adjusted after deduction of the control transcript level. (a) During stem development (2, 4, 8, 16, and 20 weeks after sowing); (b) during leaf development (YL, young leaf; IL, immature leaf; ML, mature leaf); (c) during flower development (YF, young flower; IF, immature flower; MF, mature flower), and (d) expression pattern in various tissues and organs from 16-week-old kenaf plants. Bars show the means ± standard error of three biological replications. Letters above the error bars indicate significant differences among each other with a p < 0.05 as determined by Duncan's multiple range test (DMRT).
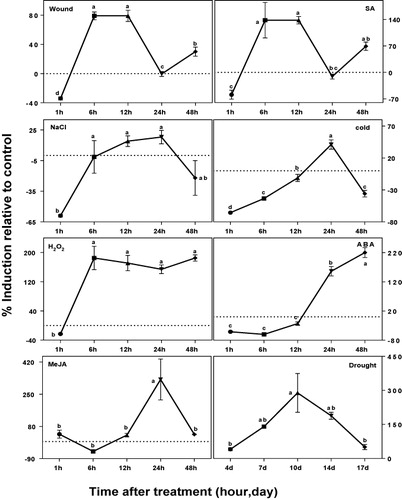
Figure 5. Transcript expression patterns of HcCCR1 in response to various abiotic stresses. Three-week-old stem tissues were subjected to different stresses including wounding, salicylic acid (SA), NaCl, cold, H2O2, methyl jasmonate (MeJA), abscisic acid (ABA), and drought. Bars show means ± the standard error of three biological replications. Different letters above the error bars indicate significant differences among groups at p < 0.05 as determined by Duncan's multiple range test (DMRT).
Supplemental material

Supplementary_material.docx

Download MS Word (44.2 KB)