Figures & data
Figure 1. Effects of PGPR Bacillus subtilis CaSUT007 on the growth and development of cassava seedling under greenhouse conditions, as measured at 14 days after inoculation. (a) cassava seedling under greenhouse conditions in sterile soil, (b) percent of seedling germination, (c) dry weight, and (d) number of lateral root.
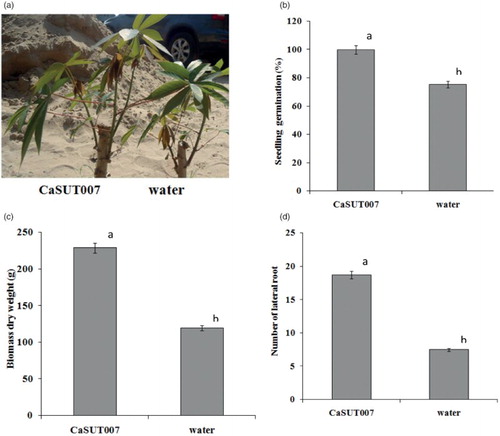
Figure 2. Functional group area maps of a part of a transverse leaf section from cassava achieved using FTIR microspectroscopy point to point mapping with aperture setting at 15 × 15 µm square aperture with 7.5 µm steps. (a) A micrograph of the untreated (control) transverse section. (b) A micrograph of a transverse cassava leaf section from CaSUT007 treated plants. (c) Integrated functional groups maps obtained under the spectral region between 1700–1580 cm–1 for untreated (control). (d) Cassava leaf treated with CaSUT007. Dimensions of the area studied of 120 × 100 µm.
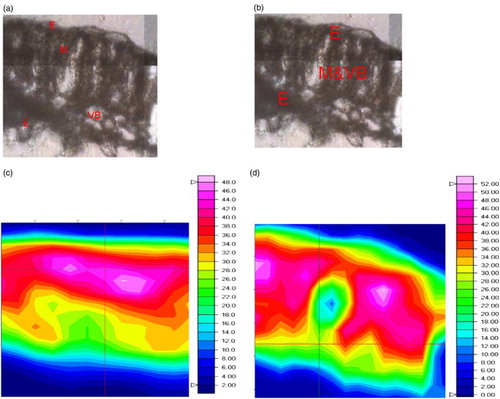
Figure 3. FTIR mapping of a cassava leaf (control). (a) 2D HCA map performed using five clusters on the range of 1800–900 cm–1. Different clusters are encoded by different colors. (b) Representative original average spectra of the spectra cluster. (c) Representative second derivative average spectra of the spectra cluster. Mesophyll (cluster 1), vascular bundle (cluster 2 and 3), and epidermis (cluster 4 and 5).
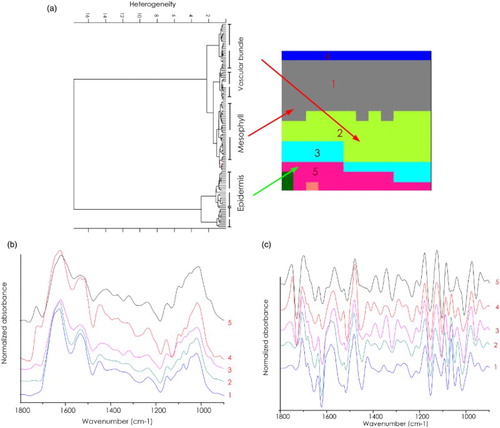
Figure 4. FTIR mapping of a cassava leaf section from CaSUT007 treated plants. (a) 2D HCA map performed using five clusters on the range of 1800–900 cm–1. Different clusters are encoded by different colors. (b) Representative original average spectra of the spectra cluster. (c) Representative second derivative average spectra of the spectra cluster.
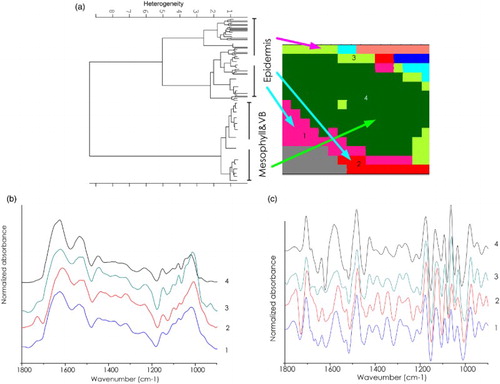
Figure 5. Overlay of the second derivative of the average spectra from a cassava leaf (control) compared with CaSUT007 treated plants. (a) Epidermis and (b) Mesophyll.
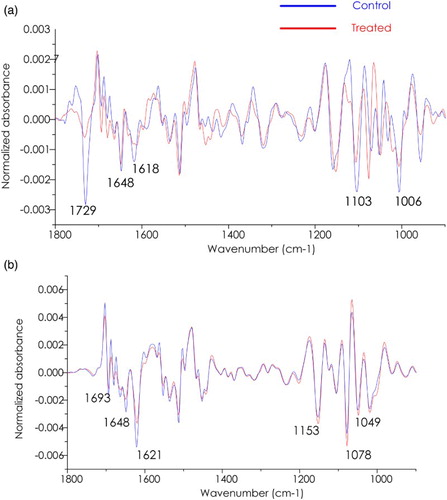
Table 1. Band assignment of IR spectra presented in the plant tissues.
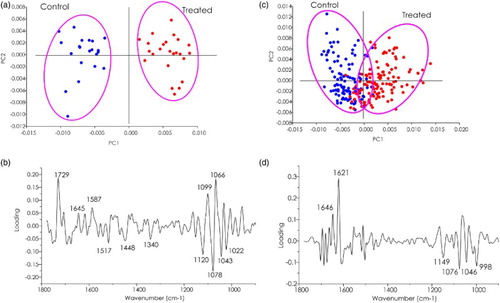
Figure 6. PCA analysis of a cassava leaf. (a) Score and (b) loading plots from PCA analysis of epidermis control groups compared CaSUT007 treated plants. (c) Score and (d) loading plots from PCA analysis of mesophyll control groups compared CaSUT007 treated plants.