Figures & data
Figure 1. Morphological view of BG-25 and Bijoy grown under PEG– and PEG+ hydroponic conditions.
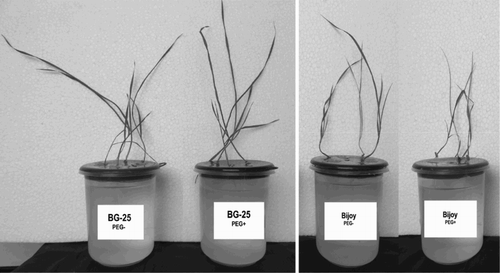
Figure 2. Chlorophyll concentrations (a and b) in leaves of BG-25 and Nijoy grown in PEG– and PEG+ hydroponic culture. Values are the means of three independent replications with standard deviations. Different letters indicate significant differences between means±SD of treatments (n = 3). Leaves were harvested from 2-week old plants.
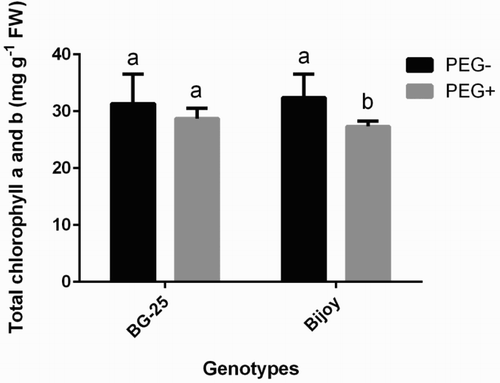
Table 1. Morphological features of BG-25 and Bijoy grown in the absence and presence of PEG under hydroponic conditions.
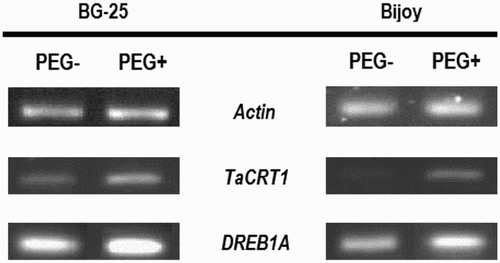
Figure 3. Expression analysis of Actin (control), TaCRT1 and DREB1A transcripts in roots of BG-25 and Bijoy grown under PEG– and PEG+ hydroponic conditions. Roots were harvested from 2-week old plants.