Figures & data
Table 1. SOD activity in developing flag leaves of six test genotypes under infested and uninfested conditions at different growth stages (units min−1 g−1 FW).
Table 2. GR activity in developing flag leaves of six test genotypes under infested and uninfested conditions at different growth stages (nmoles of NADP+ formed/min/g FW).
Table 3. PAL activity in developing flag leaves of six test genotypes under infested and uninfested conditions at different growth stages (µg g−1 FW).
Table 4. PPO activity in developing flag leaves of six test genotypes under infested and uninfested conditions at different growth stages (units min−1 mg−1 proteins).
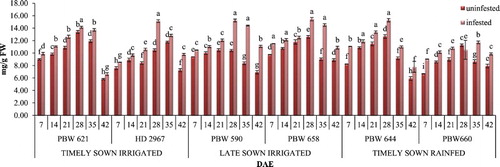
Figure 1. Change in phenol content in uninfested and infested developing flag leaves of wheat genotypes at different growth stages. Error bars denote ±SD of three replicates, bars with same letter(s) at particular day are not significantly different at P ≤ .05 (CD at 5% between ABC = 0.33; A: timely sown irrigated; B: late sown irrigated; C: timely sown rainfed).
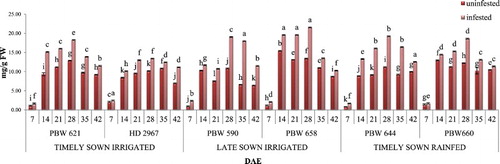
Figure 2. Change in proline content in uninfested and infested developing flag leaves of wheat genotypes at different growth stages. Error bars denote ±SD of three replicates, bars with same letter(s) at particular day are not significantly different at P ≤ .05 (CD at 5% between ABC = 0.61; A: timely sown irrigated; B: late sown irrigated; C: timely sown rainfed).
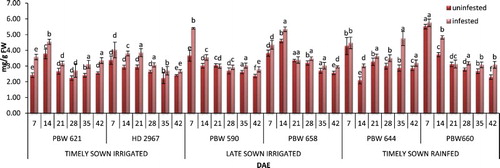
Figure 3. Change in tannin content in uninfested and infested developing flag leaves of wheat genotypes at different growth stages. Error bars denote ±SD of three replicates, bars with same letter(s) at particular day are not significantly different at P ≤ .05 (CD at 5% between ABC = 0.58; A: timely sown irrigated; B: late sown irrigated; C: timely sown rainfed).