Figures & data
Figure 1. Effects of NaCl (0, 100, and 200 mM) and SA on growth parameters at 21 days after treatments in C. tinctorius L. The groups are −SA (plants with no SA treatment), +SA (plants sprayed with 1 mM sodium salicylate three times a week for every other day). Data are the means ± SE. Means with different letters indicate a significant difference at P ≤ .05 using Duncan’s multiple range test.
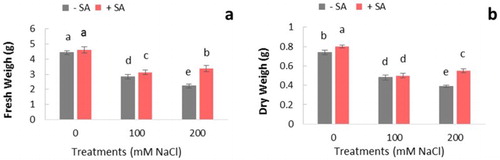
Figure 2. Effect of salinity (0, 100, and 200 mM NaCl) and exogenous application of on SA content in leaves of safflower plants at 21 days after treatments. The groups are −SA (plants with no SA treatment) and SA (plants sprayed with 1 mM sodium salicylate three times a week for every other day). Columns indicate mean ± SE. Means with different letters indicate a significant difference at P ≤ .05 using Duncan multiple range test.
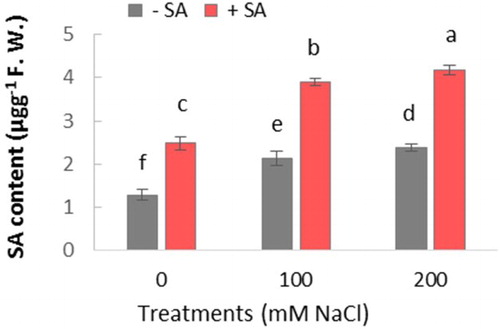
Figure 3. Effect of salinity (0, 100, and 200 mM NaCl) and exogenous application of SA on content of (a) MDA and (b) H2O2 in leaves of safflower plants at 21 days after treatments. The groups are −SA (plants with no SA treatment) and +SA (plants sprayed with 1 mM sodium salicylate three times a week for every other day). Columns indicate mean ± SE based on three replicates. Means with different letters indicate a significant difference at P ≤ .05 using Duncan multiple range test.
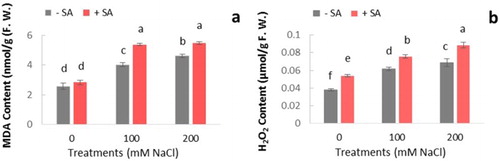
Table 1. Specific activity of five antioxidative enzymes in safflower treated with NaCl (0, 100, and 200 mM) and SA treatment at 21 days after treatments.
Figure 4. Effect of salinity (0, 100, and 200 mM NaCl) and exogenous application of SA on PAL activity in leaves of safflower plants at 21 days after treatments. The groups are −SA (plants with no SA treatment) and +SA (plants sprayed with 1 mM sodium salicylate three times a week for every other day). Columns indicate mean ± SE based on three replicates. Means with different letters indicate a significant difference at P ≤ .05 using Duncan’s multiple range test.
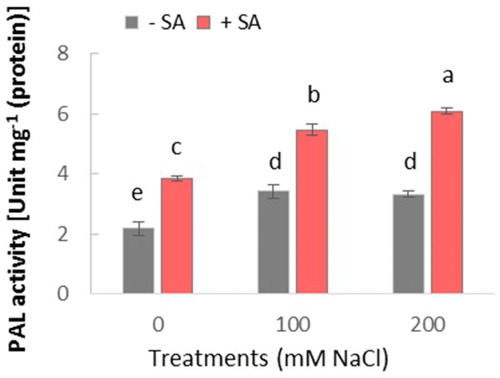
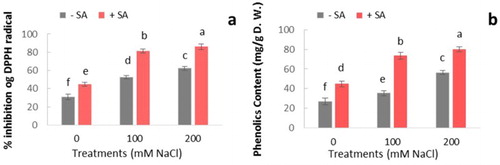
Figure 5. Effect of salinity (0, 100, and 200 mM NaCl) and exogenous application of SA on (a) DPPH scavenging activity and (b) total phenolics content in leaves of safflower plants at 21 days after treatments. The groups are −SA (plants with no SA treatment) and +SA (plants sprayed with 1 mM sodium salicylate three times a week for every other day). Columns indicate mean ± SE based on three replicates. Means with different letters indicate a significant difference at P ≤ .05 using Duncan multiple range test.