Figures & data
Figure 1. Comparison of averaged total biomass (mean + SE, n = 72) of maize and faba bean inoculated with or without AMF and grown in monoculture (Mono) and intercropping (Inter) (A); average total biomass (mean + SE, n = 6) of maize and faba bean grown in monoculture (Mono) and intercropping (Inter) under the low P (B) and high P (C) treatments. W, W–D and D represent well-watered (W), alternative well-watered and droughted (W–D) and droughted treatments (D) respectively. The same lowercase and uppercase letters indicate that faba bean or maize total biomass do not differ significantly among different planting patterns with and without AMF inoculation in each water treatment according to Tukey’s HSD test at P < 0.05.
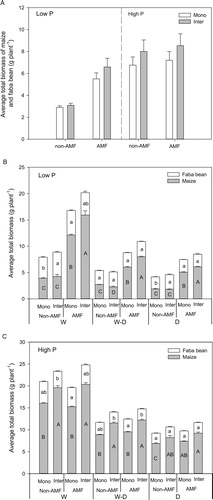
Figure 2. P uptake (mean + SE, n = 6) of maize and faba bean in monoculture (Mono) and intercropping (Inter) at low P (A, C) and high P (B, D) supply levels. W, W–D and D represent well-watered (W), alternative well-watered and droughted (W–D) and droughted treatments (D) respectively. Bars topped by the same uppercase letters do not differ significantly among average photosynthesis rate of monoculture and intercropping under different AMF and water treatments according to Tukey’s HSD test at P < 0.05. Bars topped by the same lowercase letters do not differ significantly among different planting patterns with and without AMF inoculation in each water treatment at P < 0.05 according to Tukey’s HSD test.
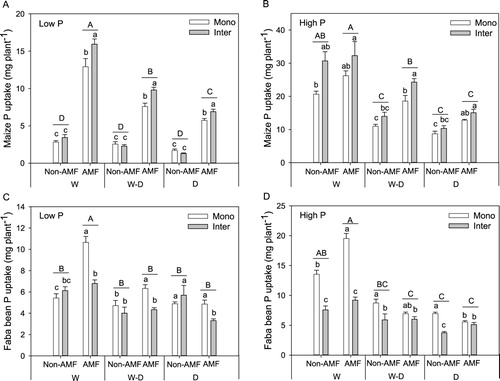
Figure 3. Water use efficiency (WUE) (mean + SE, n = 6) in maize (M) and faba bean (F) grown in monoculture or intercropping (M/F) at low P (A) and high P (B) supply levels. W, W–D and D represent well-watered (W), alternative well-watered and droughted (W–D) and droughted treatments (D) respectively. Bars topped by the same uppercase letters do not differ significantly among average WUE of the three water treatments in the two AMF and three cropping system treatments according to Tukey’s HSD test at P < 0.05. Bars topped by the same lowercase letters do not significantly differ among water treatments with and without AMF inoculation in each cropping system at P < 0.05 according to Tukey’s HSD test.
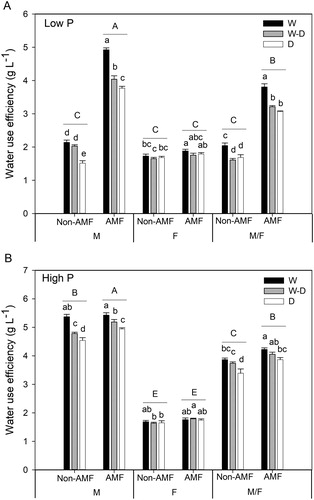
Figure 4. Photosynthesis rate (mean + SE, n = 4) of maize and faba bean in monoculture (Mono) and intercropping (Inter) at low P (A, C) and high P (B, D) supply levels. W, W–D and D represent well-watered (W), alternative well-watered and droughted (W–D) and droughted treatments (D) respectively. Bars topped by the same uppercase letters do not differ significantly among average photosynthesis rate of monoculture and intercropping under different AMF and water treatments according to Tukey’s HSD test at P < 0.05. Bars topped by the same lowercase letters do not differ significantly among different planting patterns with and without AMF inoculation in each water treatment at P < 0.05 according to Tukey’s HSD test.
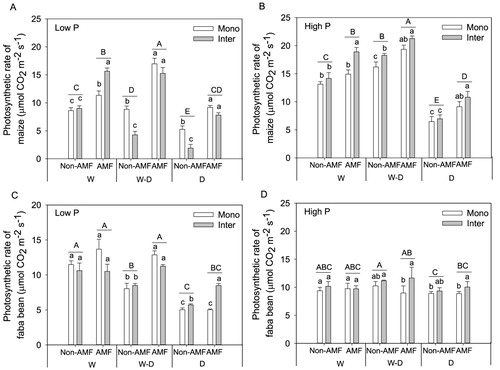
Figure 5. Stomatal conductance (mean + SE, n = 4) of maize and faba bean in monoculture (Mono) and intercropping (Inter) at low P (A, C) and high P (B, D) supply levels. W, W–D and D represent well-watered (W), alternative well-watered and droughted (W–D) and droughted treatments (D) respectively. Bars topped by the same uppercase letters do not differ significantly among average stomatal conductance of monoculture and intercropping under different AMF and water treatments according to Tukey’s HSD test at P < 0.05. Bars topped by the same lowercase letters do not differ significantly among different planting patterns with and without AMF inoculation in each water treatment at P < 0.05 according to Tukey’s HSD test.
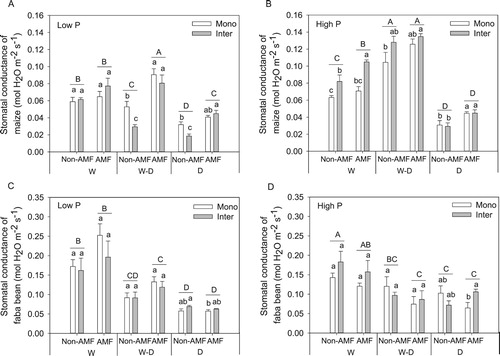
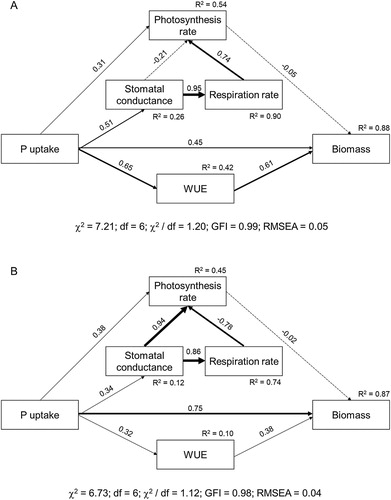
Figure 6. Effects of five variables on crop biomass at low P (A) and high P level (B). The width of arrows indicates the strength of the causal effect. Bold and dashed lines indicate significant (P ≤ 0.05) and non-significant (P > 0.05) pathway respectively. The numbers above the arrows indicate path coefficients. R2 values represent the proportion of the variance explained for each variable. ‘χ2’, ‘df’, ‘GFI’ and ‘RMSEA’ represent Chi-square, degree of freedom, goodness of fit index and root mean square error of approximation respectively.