Figures & data
Table 1. Dry matter (DM) and grain yield (GY) of 20 wheat genotypes grown under control (C) and drought stress (D) and ANOVA analyze of variance.
Figure 1. Changes of daily maximum and minimum air temperature (a), air relative humidity RH (b) and growth degree days GDD (c). Red line on x-axis marks the period of drought.
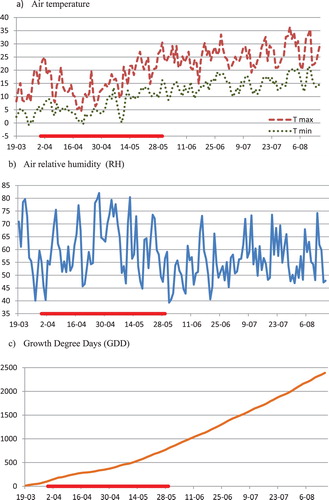
Table 2. Mean values, range of mean, LSD0,05, and coefficient of variation (CV) for the physiological traits of wheat genotypes grown in control (C) and drought (D) conditions.
Table 3. Relative change of measured traits (RTC), mean values, LSD0.05, coefficient of variation (CV) and correlation coefficient for traits of 20 wheat genotypes.
Table 4. Drought tolerance indexes calculated for dry biomass of above-ground plant part (DM) and grain yield (GY) of 20 wheat genotypes grown in control (C) and drought (D) conditions and analyze of variance ANOVA.
Table 5. Linear correlation coefficient between different drought tolerance indexes of wheat genotypes (df = 18).
Figure 2. Principal component analysis (PCA) for physiological traits (a) and genotypes (b) based on stress indexes calculated for physiological traits.
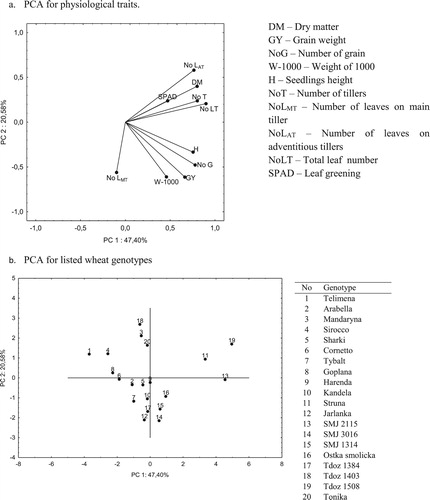
Figure 3. Principal component analysis (PCA) of drought tolerance indexes for (a) dry biomass (DM) and (b) genotypes.
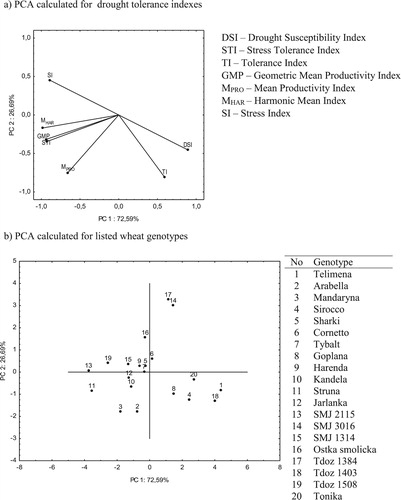
Figure 4. Dendrogram of 20 wheat genotypes resulting from cluster analysis (Ward’s methods) of stress index (SI) calculated for physiological traits (a) and drought tolerance indexes (b).
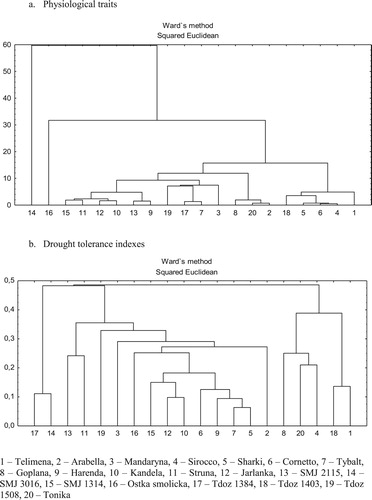
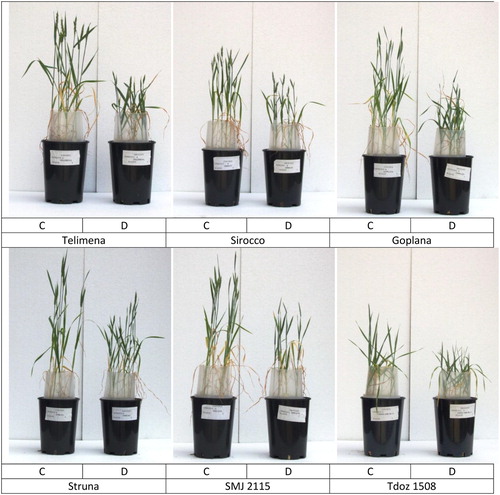
Figure 5. The photographs of 11-week-old wheat plants grown in control (C) or drought (D) conditions. Telimena, Sirocco and Goplana were selected as drought-sensitive genotypes and Struna, SMJ 2115 and Tdoz 1508 as drought-resistant genotypes.