Figures & data
Table 1. Summary of most important genes analyzed and involved in nitrate and ammonium uptake and transport as expressed in root tissue of A. thaliana.
Figure 1. Effects of PGPR mixtures on rosette areas during long-term growth of A. thaliana plants. (A) Representative photographs of A. thaliana rosettes of plants exposed to the different treatments (control, PGPR mixture 1, PGPR mixture 2, and PGPR mixture 3) at 8, 12, 14, 16, and 19 days after transplanting (DAT), bars correspond to 1 cm. (B) Graphic representation of rosette average of plants subjected to the different treatments at 8, 12, 14, 16, and 19 DAT. Media and SE were calculated with 10 plants per treatment. Asterisks indicate significant differences among the control treatment and the three other PGPR treatments at each time (One or two-way ANOVA, p < 0.05).
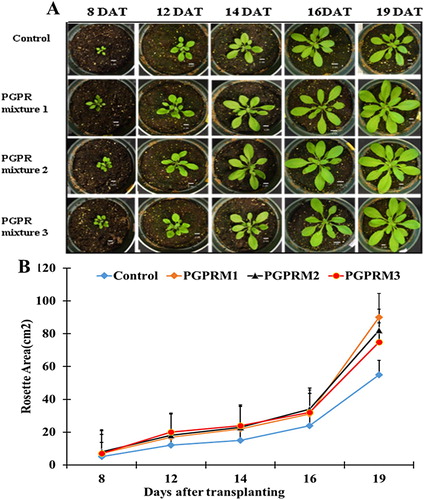
Table 2. Effect of PGPR mixtures on plant parameters: diameter, chlorophyll content (SPAD), fresh shoot weight (FSW), dry shoot weight (DSW), number of leaves, and total leaf area evaluated at 21 DAT.
Table 3. Effect of PGPR mixtures on root plant parameters: fresh root weight (FRW), dry root weight (DRW), and maximum root length at 21 DAT.
Figure 2. Effect of PGPR mixtures on A.thaliana shoot nutrient uptake. Total A. thaliana shoot uptake of nitrogen (N), phosphorus(P), and potassium (K) evaluated 21 DAT. Data are means ± SE. Columns within the same nutrient labeled with the same letter are not significantly different based on LSD test (α = 0.05).
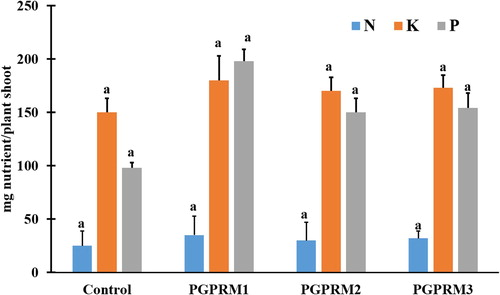
Table 4. Effect of PGPR mixtures on total nitrogen %, total Phosphorous % (calculated as PO4%), potassium % and Carbon to Nitrogen ratio (C/N) at 21 DAT.
Figure 3. Quantitative real time PCR of selected nitrate uptake (AtNRT1.1, AtNRT2.1, AtNRT1.2, AtNRT2.2, and AtNRT2.3) and nitrate transport (AtNRT1.5) genes expressed in root tissue of A. thaliana after inoculation with three PGPR mixtures. Quantitative RT-PCR determinations of relative levels of gene expression in complete plants at 21 DAT. Data are means ± SE. Columns labeled with the same letter are not significantly different based on Tukey’s test (α = 0.05).
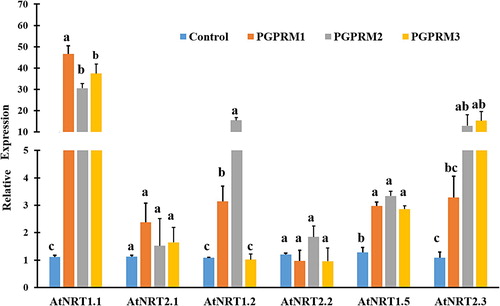
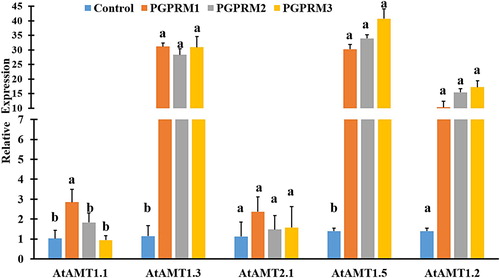
Figure 4. Quantitative real time PCR of selected ammonium uptake (AtAMT1.1, AtAMT1.2, AtAMT1.3, AtAMT1.5, and AtAMT2.1) genes expressed in root tissue of A. thaliana after inoculation with three PGPR mixtures. Quantitative RT-PCR determinations of relative levels of gene expression in complete plants at 21 DAT. Data are means ± SE. Columns labeled with the same letter are not significantly different based on Tukey’s test (α = 0.05).