Figures & data
Figure 1. Volcano plot. The number of differentially expressed genes of wide-type roots at 17°C vs 22°C(A) and 22°C vs 27°C (B). Red means up-regulated genes, green means down-regulated genes, and blue means no significant genes.
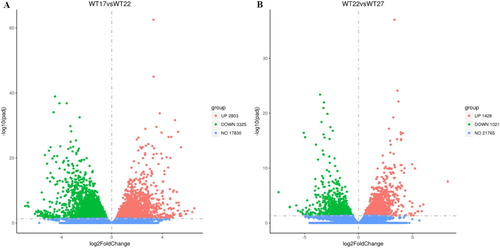
Table 1. GO and KEGG classification of low temperature-regulated transcripts.
Table 2. GO and KEGG classification of high temperature-regulated transcripts.
Table 3. Identification of hormone-related genes elevated ambient temperature.
Figure 2. (A, B) Relative expression of 18 genes presented by qRT-PCR (left side) and RNA-seq (right side).
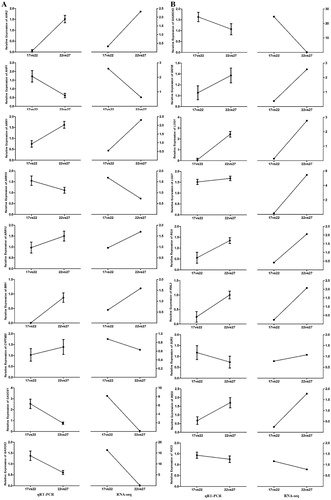
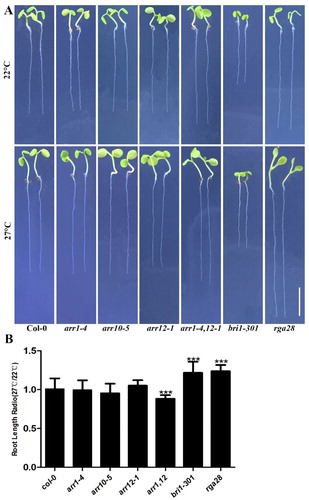
Figure 3. Phenotypes of mutant response to different ambient temperatures. (A) Seedlings were grown on vertical MS plates at 22°C, and 27°C for 7 days. Bar = 5 mm. (B) Relative ratios of root lengths in mutants grown under the same conditions. (n = 25–50; P < 0.001, based on t-test).