
Figures & data
Table 1. Name, origin, and pedigree and/or selection history of eleven bread wheat genotypes tested.
Table 2. Soil physical analysis of the two experimental sites at Ashmon – Menofya, and Siwa Oasis during 2016/2017 growing season.
Table 3. Chemical analysis of soil saturation extract and irrigation water during 2016/2017 growing seasons.
Table 4. Mean performance combined over the two environments (under stress and adequate) as well as under each environment for yield and its components of eleven bread wheat genotypes tested.
Figure 1. Unweighted pair group method arithmetic average (UPGMA) dendrogram for eleven wheat genotypes based on the allelic data of 33 SSR and 31 EST-SSR combinations.
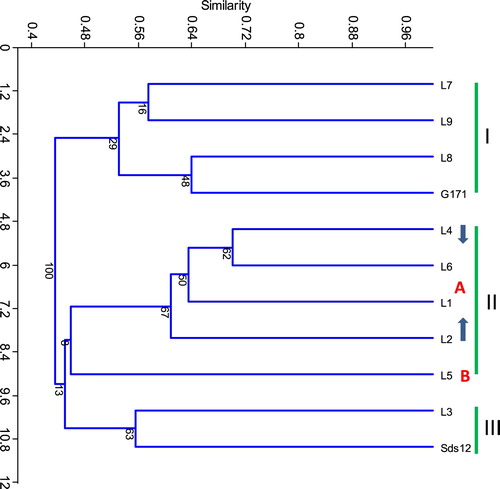
Table 5. The levels of genetic diversity in eleven wheat genotypes by SSR and EST- SSR markers.
Table 6. Specific SSR and EST-SSR markers in eleven wheat genotypes under salt stress.
Supplemental material