Figures & data
Figure 1. Average height (A) and number of leaves (B) of growing wheat plants in the greenhouse. Ureibacillus sp. 18UE/10 is marked as 18, 18+R. irregularis represents the treatment with both the bacteria and the arbuscular mycorrhiza Rhizophagus irregularis. Symbols representing average data are as follows: control (open circles), R. irregularis (closed circles), strain 18 (diamonds) and strain 18+R. irregularis (triangles). Vertical bars indicate SE (n = 5).
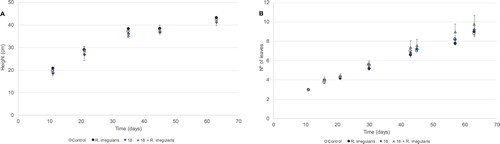
Figure 2. Average fresh (A) and dry weight (B) of growing wheat plants in the greenhouse assay. Light and darker columns represent shoots and roots, respectively. In B, root/shoot ratio is represented by dots. Ureibacillus sp. 18UE/10 is marked as 18, 18+R. irregularis refers to the treatment with both the bacteria and the arbuscular mycorrhiza Rhizophagus irregularis. Vertical bars indicate SE (n = 5). The different letters indicate results that are statistically significantly different (P < 0.05).
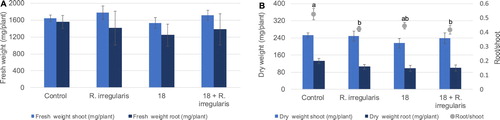
Figure 3. Average total nitrogen (A) and carbon (B) assimilation as well as content (in percentage) for shoots and roots of wheat plants from the greenhouse assay. The columns with the lighter and darker pattern represent total N or C in plant shoot and root, respectively. Average nitrogen and carbon percentages for shoots and roots are represented by lighter and darker dots, respectively. Characters TN, TC, %N and %C, inserted in the graphs, represent total nitrogen, total carbon, N content (%) and C content (%), respectively. In (C) the ratio between carbon and nitrogen content is represented for the plants’ shoot (light column) and root (darker column). Characters C/N (S) and C/N (R), inserted in the graph, represent average C/N ratio for shoots and roots, respectively. Other terms are as in the legend of the precedent figures. Vertical bars indicate SE (n = 5). The different letters indicate results that are statistically significantly different (P < 0.05).
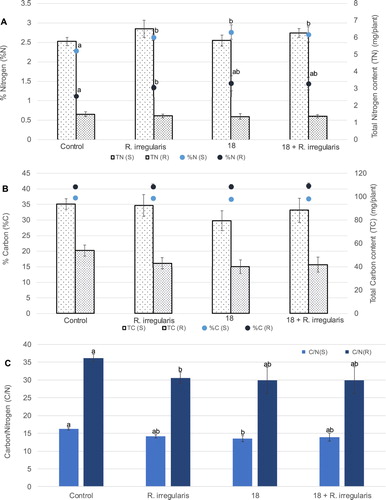
Figure 4. Average ratio of nitrogen isotopes 15N/14N (δ15N) (A) and of carbon isotopes 13C/12C (δ13C) (B) in shoots from wheat plants grown in the greenhouse. Ureibacillus sp. 18UE/10 is marked as 18, 18+R.irregularis represents the treatment with both the bacteria and the arbuscular mycorrhiza Rhizophagus irregularis. Vertical bars indicate SE (n = 3). The different letters indicate results that are statistically significantly different (P < 0.05).
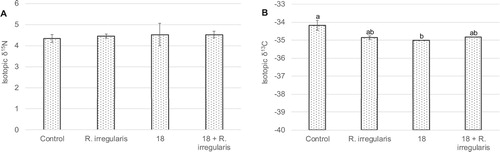
Figure 5. Average total phosphorus assimilation as well as content (in percentage) for shoots and roots of wheat plants from the greenhouse assay. The columns with the lighter and darker pattern represent total P in plant shoot and root, respectively. Average phosphorus percentages for shoots and roots are represented by lighter and darker dots, respectively. Characters TP and %P, inserted in the graphs, represent total phosphorus and P content (%), respectively. Characters (S) and (R), inserted in the graph, represent shoots and roots, respectively. Other terms are as in the legend of the precedent figures. Vertical bars indicate SE (n = 5). The different letters indicate results that are statistically significantly different (P < 0.05).
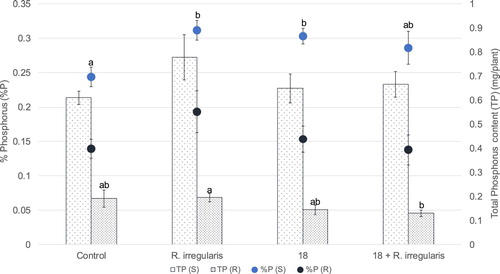
Table 1. Content of ionomic elements in shoot tissue.
Table 2. Content of ionomic elements in root tissue.
Figure 6. Linear discriminant analysis (LDA) of shoot (A) and root (B) element content by treatment. Symbols represent individual data from Control (open cicles), R. irregularis (closed circles), bacterial strain 18 (triangles) and strain 18+R. irregularis (asteriks) treated plants. Discriminant axis 1 (xx) accounts for 64% and discriminant axis 2 (yy) for 31% of the variance for shoot concentration, and 77% (axis 1) and 13% (axis 2) for root concentration. Ellipses that enclose data points represent regions that include 95% of the theoretical distribution of scores for each treatment. The length of each eigenvector is proportional to the variance in the data for that element.
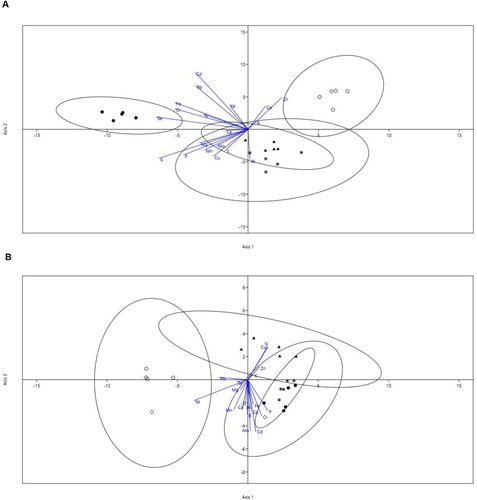
Figure 7. Effect of wheat root exudate(_E) on the number of colony-forming units (cfu) per mL, after 24 h growth at 50°C and at 25°C. Initial and final (after 24 h) cfu/mL are indicated by light and darker dots, respectively. The different letters a or a’ versus b or b’ indicate results that are statistically significantly different at P < 0.0002 according to Student’s t-test. Values for SD (n = 3) are smaller than the represented symbols.
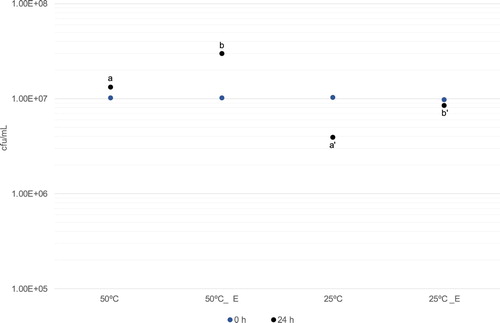
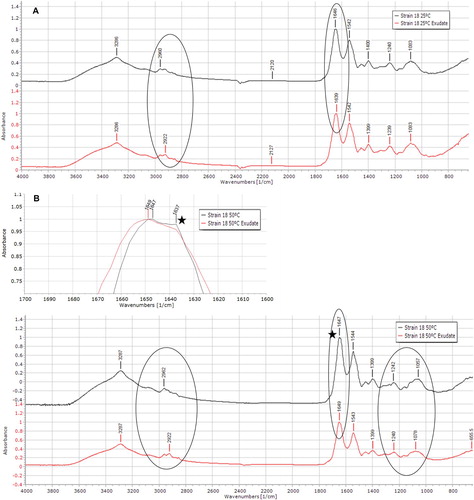
Figure 8. Normalized spectra of Ureibacillus sp. 18UE/10 (strain 18) cultured at 25°C (A) and 50°C (B) in the absence (top spectrum) or presence (bottom spectrum) of wheat root exudate. The ellipses highlight the regions where differences caused by the exudate addition are visible. The zone marked with a star symbol, next to the 50°C spectra, is expanded at the top of the (B) panel to highlight the prominent shoulder at 1637 cm−1.