Figures & data
Figure 1. Biochemical analysis of Mangifera indica L. cv. Keitt response to chilling at different times. (A), chlorophyll content, (B) carotenoid content, (C) CAT enzyme activity, (D) POD enzyme activity. The columns with the different letters mean significant difference (P < 0.05) between different times of exposure. Bar indicates standard error.
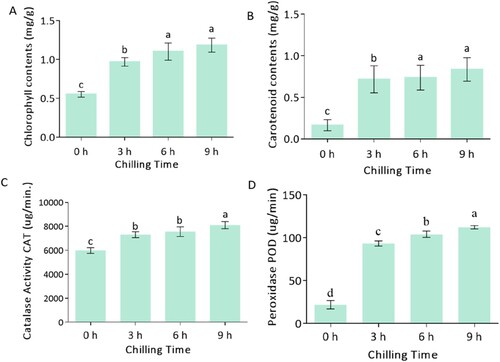
Figure 2. A representation of RNA-Seq gene expression distribution. (A) Fragments per kilobase million (FPKM) values across the orders of magnitude in the mapped reads. (B), Violin plot in the expression of the sample, (C) the principal component analysis (PCA) (D), the value of the relationship between the sample correlation coefficient.
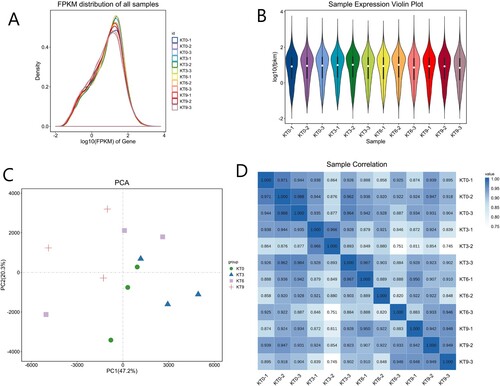
Table 1. Statistics of RNA-seq reads obtained from 12 libraries.
Table 2. Statistics of RNA-seq reads obtained from 12 libraries compared to the reference genome.
Figure 3. The distribution of the differentially expressed genes in ‘Keitt’ leaves exposed to chilling stress.
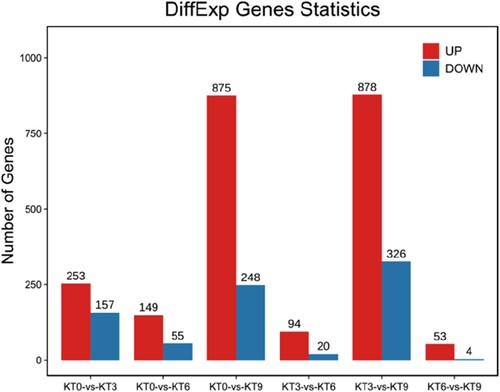
Figure 4. The KEGG (A) and GO (B) enrichment of the DEGs between different chilling treatment time point.
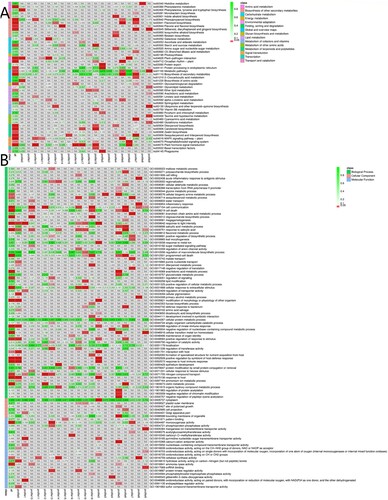
Figure 5. Gene expression trend analysis.
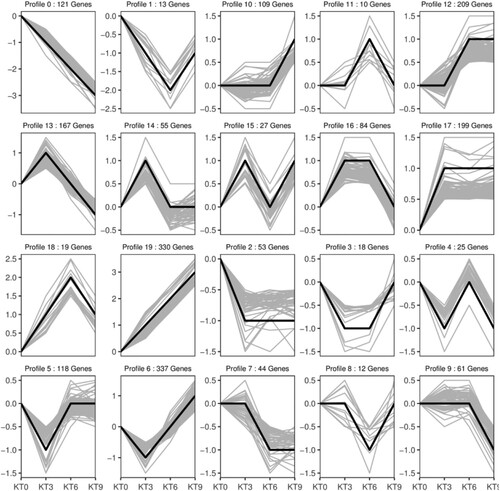
Figure 6. KEGG and GO enrichment analysis of the DEGs in the 20 expression trend profiles.
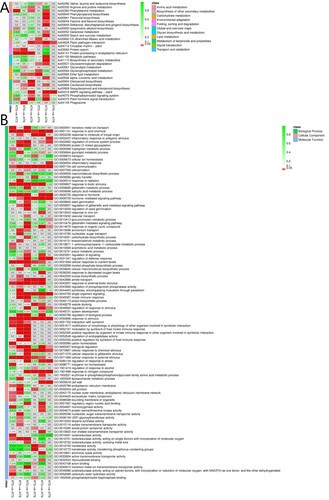
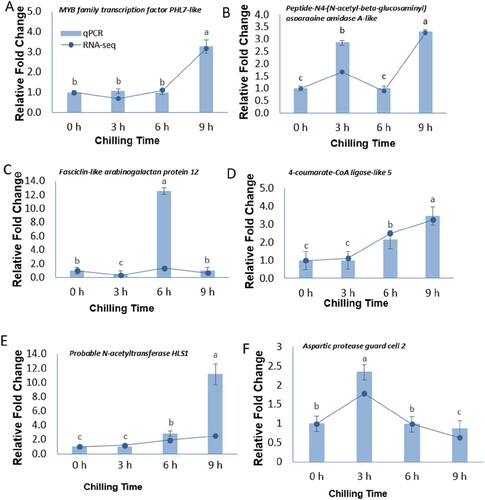
Figure 7. Relative expression levels of 6 DEGs in ‘Keitt’ leaves at 0, 3, 6, 9 h of 4°C chilling treatment determined by qRT-PCR and RNA-seq.