Figures & data
Figure 1. Schematic representation of durian seedling treatments and sample collection. Durian seedlings at about one year old with at least three branches were performed for the experiment. For each seedling, the top branch was used for disease progression, the second for H2O2 accumulation, and the third for callose production analysis. Inoculation process was performed by puncturing each leaf with a sterile needle at six spots, and randomly applying mycelial plugs of P. palmivora (two spots for low virulence and two spots for high virulence) and two for mock control, randomly. Each treatment was collected at 6, 12, 18, 24, 36, 48, and 72 hpi. Each experiment used seven seedlings for a total of 63 leaves. All experiments were repeated three times independently.
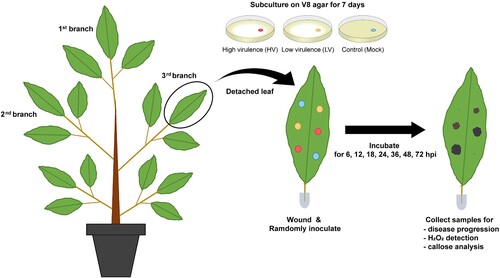
Table 1. Primers used in this study.
Figure 2. Disease progression of Phytophthora palmivora isolates on durian leaves. The study used intact durian leaves inoculated with mycelial agar plugs of the isolates high virulence (HV), low virulence (LV), and a mock as a control. The inoculation was performed for 6, 12, 18, 24, 36, 48, and 72 hpi. Disease symptoms (A) and diameter of disease lesions (B) observed on durian leaves. Disease incidence, indicating distribution of each disease score in each scale per sampling unit (C). Disease lesion scores were assessed on a scale of 0 (0–0.5 mm), 1 (0.5–1 mm), 2 (1–5 mm), 3 (5–10 mm), and 4 (≥10 mm). Values are presented as the means ± SEM. Statistical significance between the treatment groups for each time point analyzed was determined using One-way ANOVA with Tukey's multiple comparison test (*p < 0.05, **p < 0.01).
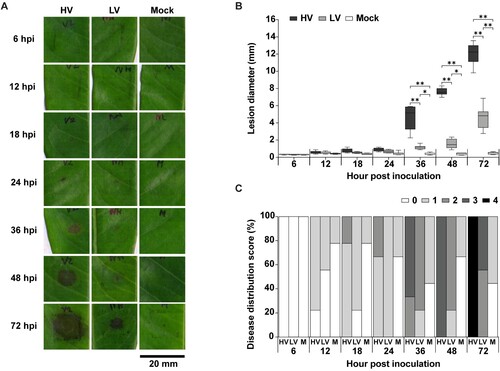
Figure 3. Colonization and sporulation of Phytophthora palmivora on durian leaves. The leaves were inoculated with mycelial agar plugs of the high virulence (HV), low virulence (LV), and a mock as a control, and incubated for 6, 12, 18, 24, 36, 48, and 72 hpi. Oomycete structures, including mycelia, sporangia, chlamydospores, were detected using trypan blue (TB) staining and observed at 40X magnification which resulted in a dark blue color (A). Mycelia colonization (B), number of sporangia (C), and number of chlamydospores (D), were measured. Values are presented as the means ± SEM. Statistical significance between the treatment groups for each time point analyzed was determined using One-way ANOVA with Tukey's multiple comparison test (*p < 0.05, **p < 0.01).
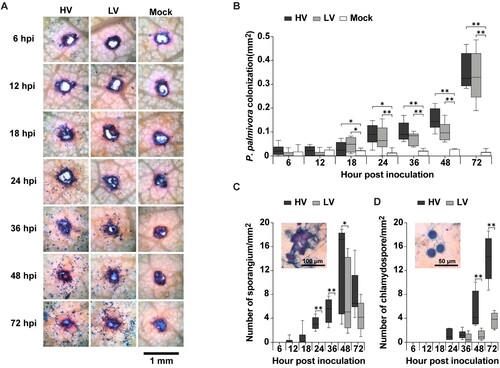
Figure 4. Quantification of the oomycete's lifestyle genes via qRT-PCR analysis. The study inoculated the leaves with mycelial agar plugs of the high virulence (HV) and low virulence (LV), and incubated for 0, 6, 12, 24, 36, 48, and 72 hpi, while MZ represents 14 days old mycelia without inoculation. The genes analyzed were PpEF1α (A), PpHmp1 (B), PpCdc14 (C), and PpOPEL (D) relative to two housekeeping genes (PpWS21 and PpACT). Values are presented as the means ± SEM. Statistical significance between the treatment groups for each time point analyzed was determined using Kruskal-Wallis test with Dunn's multiple-comparison test (*p < 0.05, **p < 0.01).
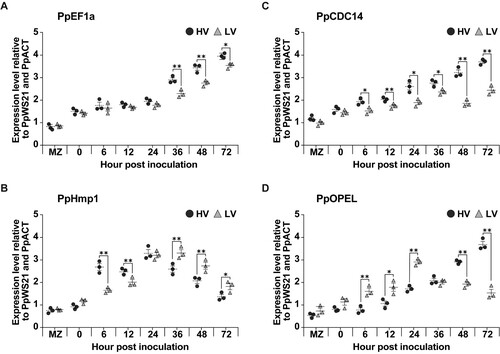
Figure 5. Hydrogen peroxide (H2O2) production in durian leaves in response to P. palmivora infection. The leaves were inoculated with mycelial agar plugs of the high virulence (HV), low virulence (LV), and a mock as a control, and incubated for 6, 12, 18, 24, 36, 48, and 72 hpi. H2O2 production was detected using 3,3’-diaminobenzidine (DAB) staining which resulted in a dark brown precipitate (A). The total diameter of DAB staining was measured (B), and two separate patterns were observed: a high intensity inner area and a low intensity outer area (C). Values are presented as the means ± SEM. Statistical significance between the treatment groups for each time point analyzed was determined using One-way ANOVA with Tukey's multiple comparison test (*p < 0.05, **p < 0.01).
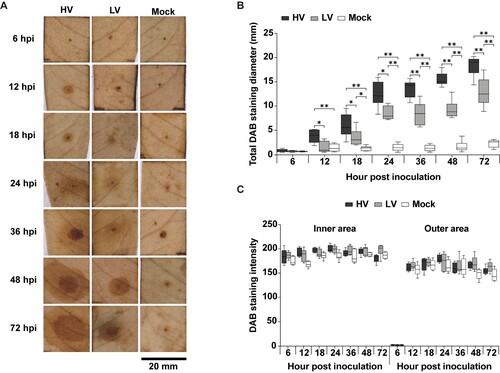
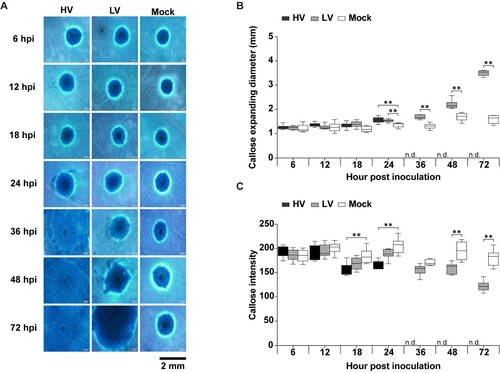
Figure 6. Callose deposition in durian leaves in response to P. palmivora infection. The leaves were inoculated with mycelial agar plugs of the high virulence (HV), low virulence (LV), and a mock as a control, and incubated for 6, 12, 18, 24, 36, 48, and 72 hpi. Callose deposition was detected by aniline blue staining, which appeared as a ring-shaped fluorescent signal under the microscope with an ultraviolet (UV) filter (A). The total expanding diameter of the callose ring (B) and callose ring intensity (C) were measured around the perforated site on a leaf area of about 3.5 × 2.5 mm2.‘N.d.’ indicates no available data, meaning that the callose ring extended beyond the observable area under the microscope. Values are presented as the means ± SEM. Statistical significance between the treatment groups for each time point analyzed was determined using One-way ANOVA with Tukey's multiple comparison test (*p < 0.05, **p < 0.01).