
Figures & data
Table 1. General statistics of RNA quality and sequencing results.
Figure 1. Volcano plot showing the DEGs of the (A) Pt vs. CK comparison, (B) 3CPt vs. CK comparison and (C) 3C vs. CK comparison. The upregulated genes with statistical significance are represented by the green dots, the red dots represent the downregulated genes, and the grey dots are the DEGs with -log10padj <1.3, adopting a log2FoldChange threshold of 0.58 (1.5-fold change). The X-axis corresponds to the variation in gene expression, and the Y-axis corresponds to the -log10padj.
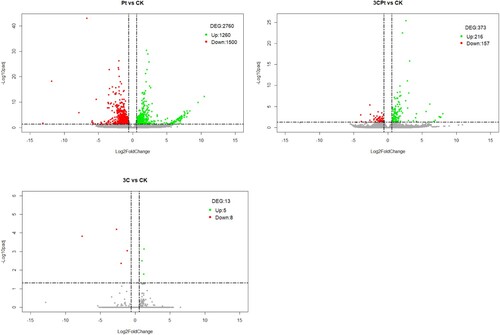
Figure 2. GO Gene Ontology (GO) Enrichment Analysis. The X-axis indicates the number of DEGs for each term, and the Y-axis indicates the terms represented for each comparison. BP: biological processes; MF: molecular functions.
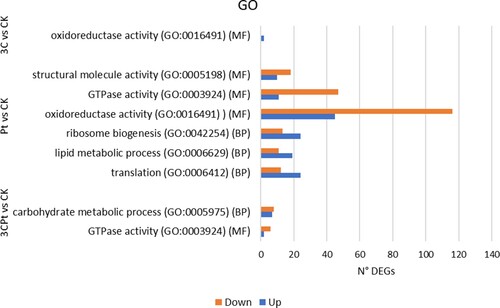
Table 2. Number of deregulated genes belonging to various metabolic pathways and processes as a result of MapMan analysis.
Table 3. List of clusters in Pt vs. CK and 3CPt vs. CK comparisons.
Table 4. Clusters in common between the Pt vs. CK and 3CPt vs. CK comparisons.
Table 5. Lists of WRKY transcription factors deregulated in lemon 2Kr and rough lemon (Russo et al. Citation2021).