
Figures & data
Figure 1. Changes in the physiological structure of tobacco leaf cells after 14 days of growth in Hoagland nutrient solution under different chloride (Cl−) salinity treatments. CK: control treatment; T1: 15 mg/L Cl− salinity; T2: 30 mg/L Cl− salinity; T3: 60 mg/L Cl− salinity; T4: 120 mg/L Cl− salinity. Abbreviations: Ch, chloroplasts; Cw, cell wall; Cy, cytoplasm; Cm, cell membrane; St, starch granules; Mi, mitochondria; Th, thylakoid; OG, osmiophilic granules.
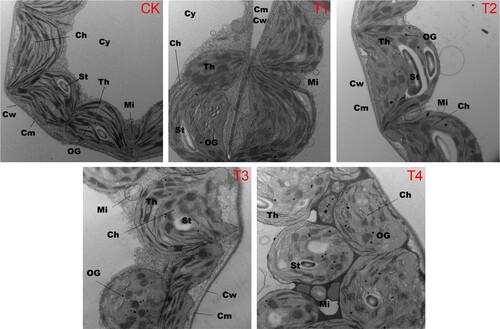
Figure 2. Physiological parameters of tobacco leaves grown in Hoagland nutrient solution under different Cl− salinity conditions after 7, 14, and 21 days. (A) Malondialdehyde (MDA) content; (B) Superoxide dismutase (SOD) activity; (C) Peroxidase (POD) activity; and (D) Catalase (CAT) activity. CK: control treatment; T1: 15 mg/L Cl− salinity; T2: 30 mg/L Cl− salinity; T3: 60 mg/L Cl− salinity; T4: 120 mg/L Cl− salinity. Data are shown as the means ± SD (n = 3), with different letters indicating significant differences at P < 0.05 according to the LSD test.
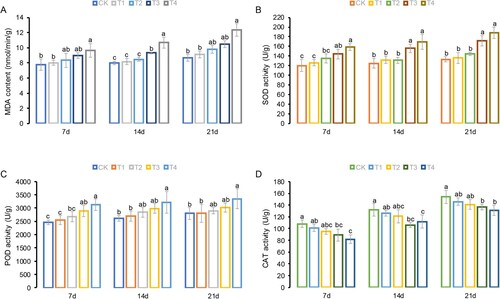
Figure 3. The number (A) and distribution (B) of differentially expressed genes (DEGs) on chromosomes.
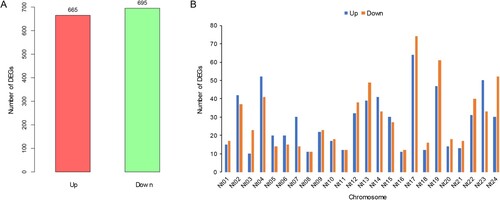
Figure 4. The Gene Ontology (GO) enrichment analysis of up-regulated (A) and down-regulated (B) DEGs. The horizontal axis represents the –log10 (P value) and number of genes of terms related to biological processes, cellular components, and molecular functions. The vertical axis shows the GO term names. The number of genes for each term is shown on the right in blue on the histogram.
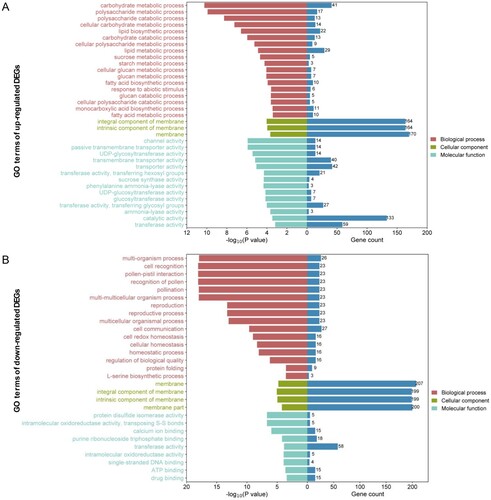
Figure 5. The Kyoto Encyclopedia of Genes and Genomes (KEGG) pathway enrichment analysis of up-regulated (A) and down-regulated (B) DEGs. The red and blue rectangle boxes show the top five KEGG pathways based on the –log10 (P value).
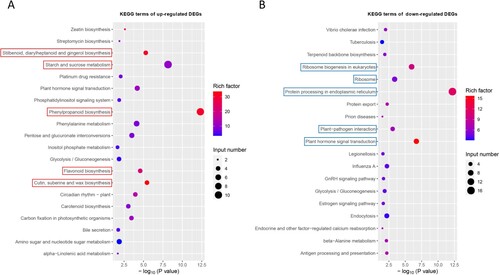
Figure 6. MapMan visualization of differential gene expression changes in tobacco leaves induced by chloride salinity. The DEGs for metabolism overview (A), secondary metabolism (B), chloroplast (C), and mitochondrial e-transport (D) were imported and visualized using MapMan. Blue represents the up-regulation of differentially expressed genes (Log2 fold changes) relative to the control under Cl– salinity treatment, and red represents down-regulation.
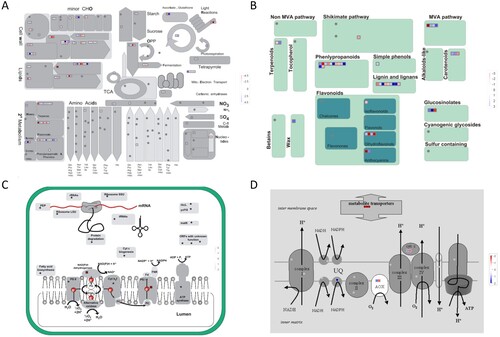
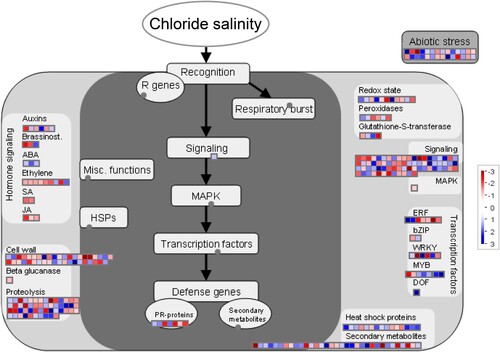
Figure 7. MapMan-based stress pathways of DEGs in response to chloride salinity in tobacco seedling leaves. Blue represents the up-regulation of DEGs (log2 fold changes) relative to the control under Cl– salinity treatment, and red represents down-regulation.
Supplemental Material
Download MS Excel (33.3 KB)Data availability statement
All RNA-Seq data were deposited in the NCBI Sequence Read Archive (SRA) under the accession number PRJNA1045972.