Figures & data
Table 1. Primer pairs used in this study.
Figure 1. Effects of nitrogen reduction combined with Biochar on Plant height (A), Root length (B), Aboveground/Underground Biomass (C, D) and Aboveground/Underground fresh weight (E, F) of Tobacco plants. Notes: The addition of biochar to soil with reduced nitrogen levels is denoted as LN+C, no biochar is applied to nitrogen-reduced soils, which are abbreviated as LN-C. The addition of biochar to conventionally nitrogen fertilized soil is denoted as WT+C, no biochar is applied to conventional nitrogen fertilized soil is denoted as WT-C. The data in the figure are from three replicated (n = 11), and represent means ± standard error (SE). Different lowercase letters indicate significant differences (P < 0.05).
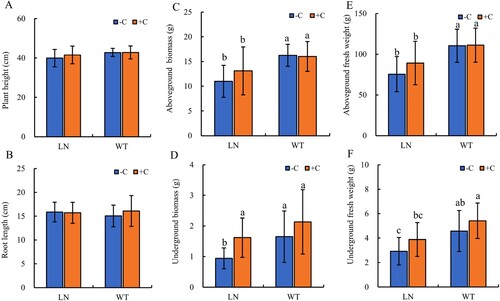
Figure 2. Effects of nitrogen and biochar treatment on volcano plot of DEGs (A–E) and KEGG pathways enrichment analysis of DEGs (F–J) in tobacco leaves. Note: The addition of biochar to soil with reduced nitrogen levels is denoted as LN+C, no biochar is applied to nitrogen-reduced soils, which are abbreviated as LN-C. The addition of biochar to conventionally nitrogen fertilized soil is denoted as WT+C, no biochar is applied to conventional nitrogen fertilized soil is denoted as WT-C.
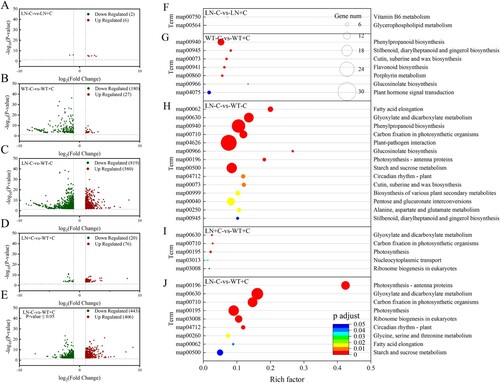
Figure 3. Chlorophyll fluorescence curves and parameters in tobacco leaves under nitrogen and biochar treatment. Note: The addition of biochar to soil with reduced nitrogen levels is denoted as LN+C, no biochar is applied to nitrogen-reduced soils, which are abbreviated as LN-C. The addition of biochar to conventionally nitrogen fertilized soil is denoted as WT+C, no biochar is applied to conventional nitrogen fertilized soil is denoted as WT-C. The data in the figure are from three replicated (n = 11), and represent means ± standard error (SE). Different lowercase letters indicate significant differences (P < 0.05).
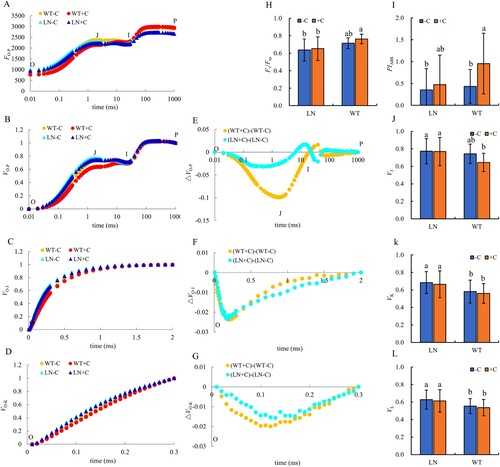
Figure 4. Effect of nitrogen and biochar treatmeat on ABS/RC (A), ETo/RC (B), DIo/RC (C), ABS/CSm(D), ETo/CSm (E), and DIo/CSm (F) in tobacco leaves. Note: The addition of biochar to soil with reduced nitrogen levels is denoted as LN+C, no biochar is applied to nitrogen-reduced soils, which are abbreviated as LN-C. The addition of biochar to conventionally nitrogen fertilized soil is denoted as WT+C, no biochar is applied to conventional nitrogen fertilized soil is denoted as WT-C. The data in the figure are from three replicated (n = 11), and represent means ± standard error (SE). Different lowercase letters indicate significant differences (P < 0.05).
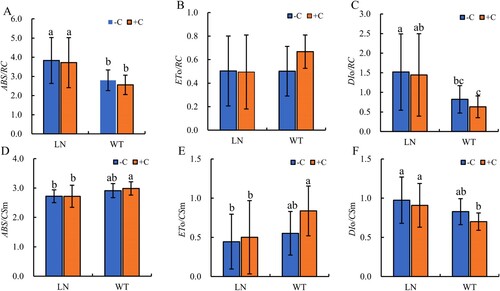
Figure 5. The key genes expression of photosynthetic-antenna proteins in tobacco leaves under nitrogen and biochar treatmeat. Abbreviations: Lhca2: light-harvesting complex I chlorophyll a/b binding protein 2; Lhca3: light-harvesting complex I chlorophyll a/b binding protein 3; Lhca4:light-harvesting complex I chlorophyll a/b binding protein 4; Lhca5:light-harvesting complex I chlorophyll a/b binding protein 5; Lhcb2: light-harvesting complex II chlorophyll a/b binding protein 2; Lhcb3: light-harvesting complex II chlorophyll a/b binding protein 3; Lhcb5: light-harvesting complex II chlorophyll a/b binding protein 5; Lhcb6:light-harvesting complex II chlorophyll a/b binding protein 6. Notes: The data in the figure are from three biological repetitions (n = 3) means ± standard error (SE). Different lowercase letters indicate significant differences (P < 0.05).
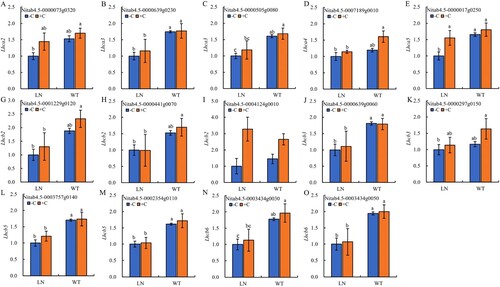
Figure 6. The key genes expression of photosynthetic electron transport in tobacco leaves under nitrogen and biochar treatmeat. Notes: The data in the figure are from three biological repetitions (n = 3) means ± standard error (SE). Different lowercase letters indicate significant differences (P < 0.05).
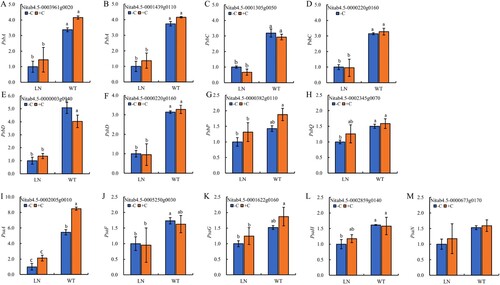
Figure 7. The related genes expression of Calvin cycle in tobacco leaves under nitrogen and biochar treatmeat. Notes: The data in the figure are from three biological repetitions (n = 3) means ± standard error (SE). Different lowercase letters indicate significant differences (P < 0.05).
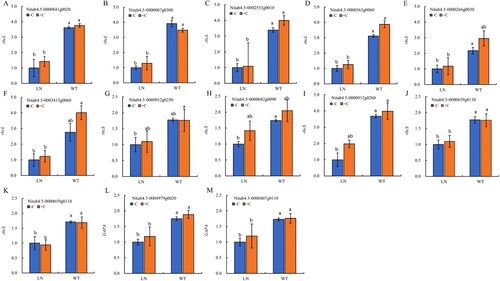
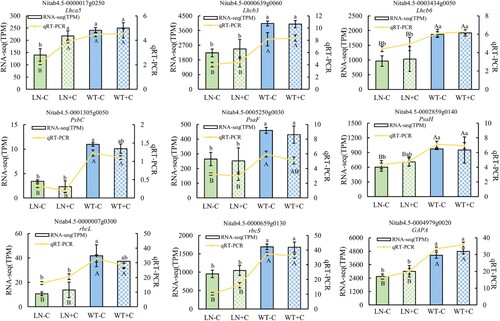
Figure 8. Verification of the RNA-seq expression by qRT-PCR. Notes: The statistical values of RNA-seq are indicated by lowercase letters, and the statistical values of qRT-PCR are indicated by uppercase letters. The data in the figure are from three biological repetitions (n = 3) means ± standard error (SE). P < 0.05 was a significant difference.