
Figures & data
Figure 1. PRISMA flow diagram.
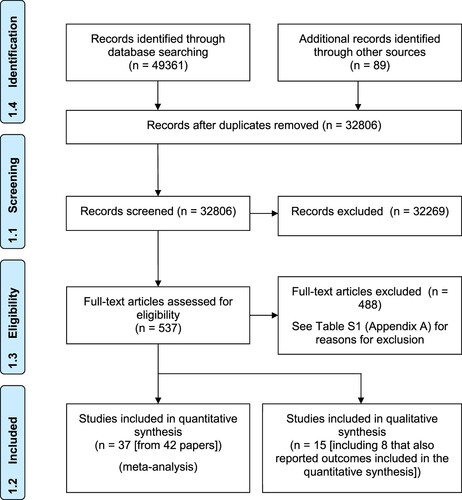
Table 1. Details of included studies.
Figure 2. Drop-out.
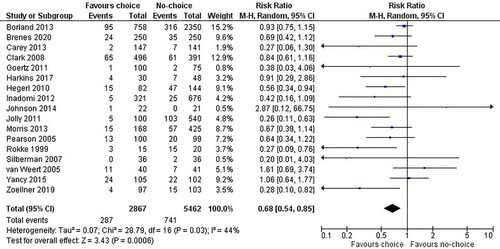
Table 2. GRADE evidence summary: Retention, behaviour change and mood.
Figure 3. Adherence.
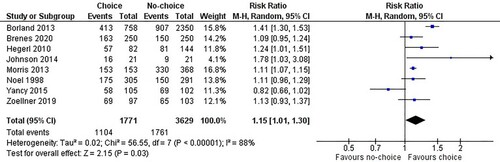
Figure 4. Satisfaction.
Notes: Beer et al., Citation2017: The intrinsic motivation inventory – enjoyment subscale; Carey et al., Citation2013: client satisfaction based on a 5-point likert scale; Chiviacowsky et al., Citation2012: single item regarding enjoyment; Patal et al., (Citation2014) Studies A–C and Patall & Leach, Citation2015: Interest-enjoyment subscale of the Intrinsic Motivation inventory; Pearson et al., Citation2005: patient satisfaction based on a 5-point likert scale; Veitch & Newsham, Citation2000: Environmental Satisfaction scale.
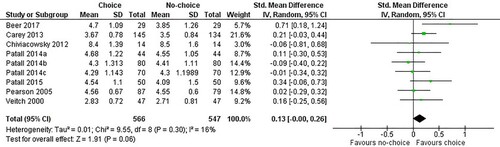
Figure 5. Total behaviour change: dichotomous outcomes.
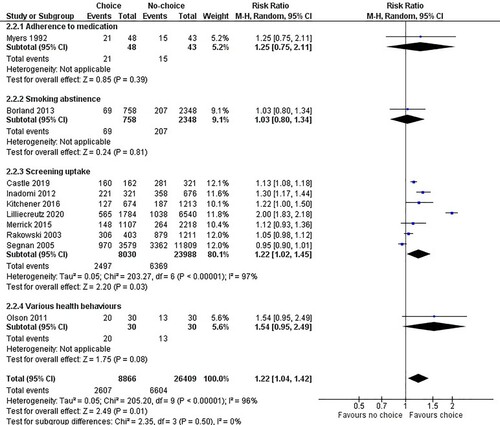
Figure 6. Total mood.
Notes: Bartley et al. Citation2016: short-form State-Trait Anxiety Inventory; Beer et al., Citation2017: Profile of Mood States – Adolescent Inventory; Brenes et al., Citation2020: Penn State Worry Questionnaire-Abbreviated; Chiviacowsky et al., Citation2012: non-validated questionnaire; Goertz et al., Citation2011: State-Trait Anxiety Inventory – State; Handelzalts & Keinan, Citation2010: Sarason’s Test Anxiety; Hegerl et al., Citation2010: Hamilton Depression Rating Scale; Rose et al., Citation2014 A: aggregated likert scales for irritated, uncomfortable and unpleasant; Veitch & Newsham, Citation2000: non-validated questionnaire – pleasure subscale; Yancy et al., Citation2015: Impact of Weight on Quality of Life-Lite questionnaire – distress subscale; Zoellner et al., Citation2019: Spielberger State-Trait Anxiety Inventory.
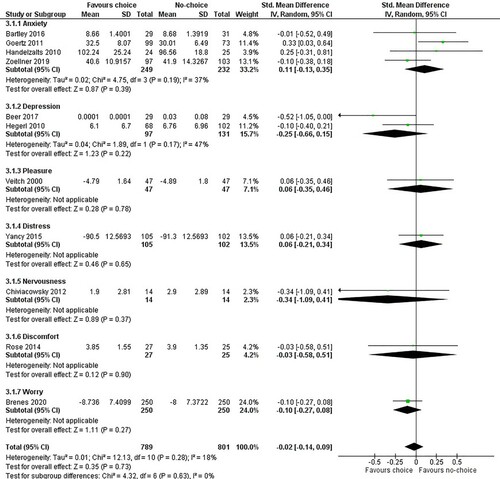
Table 3. Risk of bias ratings per outcome.
Data availability statement
All available data including the study protocol, completed data extraction tables for all included studies, and raw data including sensitivity analyses and subgroup analyses are available here: https://osf.io/b27jd/.