
Figures & data
Table 1. The eight categories of FoNS.
Table 2. Counts and proportions of FoNS in three textbooks.
Figure 1. Comparing year 1 textbooks with respect to FoNS using moving averages.
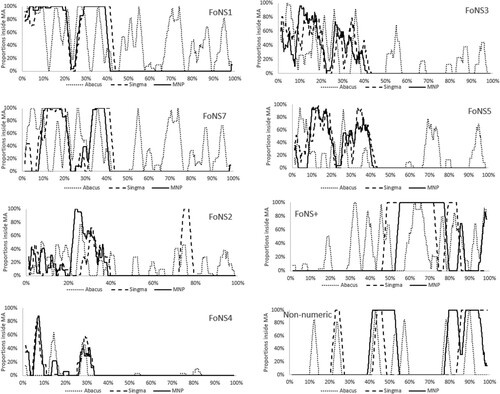
Figure 2. Data smoothing with moving averages and with adapted Lorenz-curves.
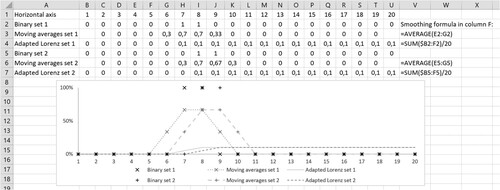
Figure 3. Generating pairwise data from disjoint sections.
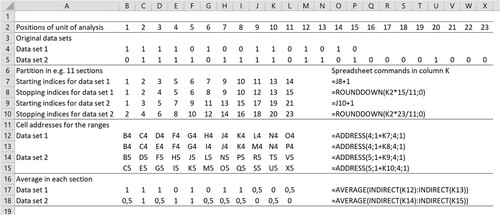
Figure 4. Generating pairwise data from moving averages.
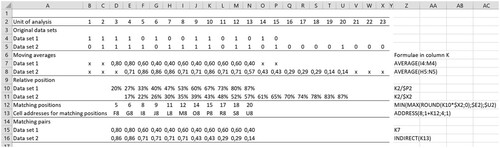
Figure 5. Euclidean similarity between Singma & Abacus.
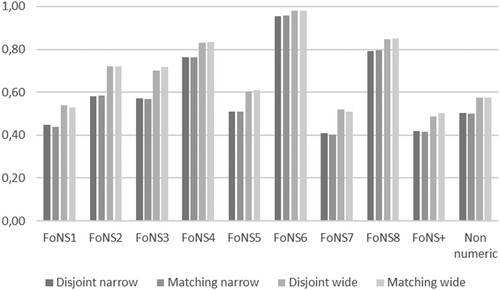
Figure 6. Euclidean similarity between Singma & MNP.
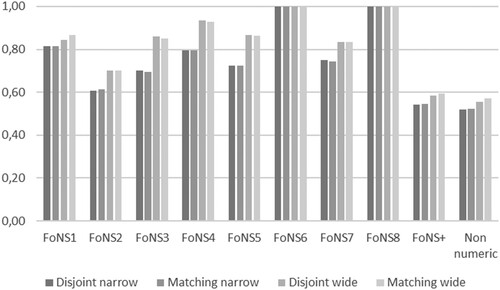
Figure 7. Euclidean similarity between Abacus & MNP.
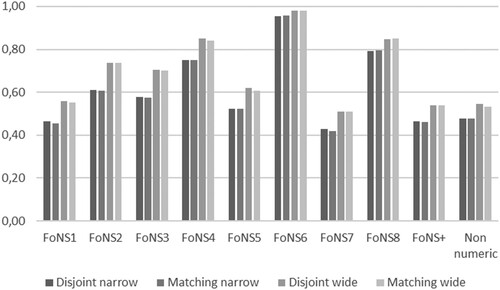
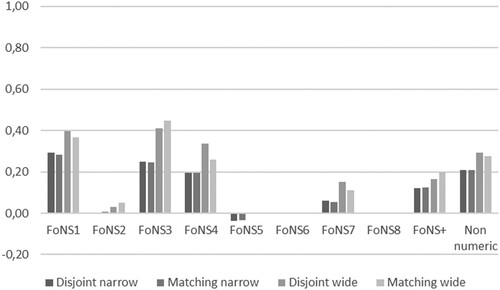
Figure 8. Pearson correlation between Singma & Abacus.
Supplemental material